Do CA scores predict regular public transit use?
Secondary research question 5 — Random Forest write-up
Project: PSYCH 755 — CA persona / PRCA framework
Analysis code: src/ca_personas/ca_transit_rf.py
Notebook: notebooks/secondary_rq_ca_transit_rf.ipynb
CLI: ca-personas ca-transit-rf --join inner
Artifacts: outputs/ca_transit_rf/
Companion memo: memos/ca_scores_predict_transit.qmd
1 Research question
Among Prolific↔︎Qualtrics matched respondents with complete PRCA ground truth, do group and interpersonal communication-apprehension (CA) scores predict whether an individual takes public transportation regularly?
This question reverses the predictive direction of the persona-tier work (where transit is an input to CA prediction) and complements the observational contrast in secondary_rq_transit_ca.md (where we tested mean CA differences by transit group). Here we ask how much out-of-sample classification signal CA carries for the binary transit outcome.
2 Methods
2.1 Sample
- Sources: Prolific File A + File B (stacked) joined to Qualtrics File C on
Q0↔︎Participant id - Analytic N: 241 respondents with complete PRCA group + interpersonal items and usable
Q26 - Class balance: 101 regular (41.9%) / 140 not regular (58.1%)
2.2 Outcome
Regular public transit = Q26 ∈ {4-8 days a month, 8 or more days a month} (weekly-or-more), matching the project’s primary transit operationalization.
Survey stem: In the last three months on how many days did you use public transportation (bus, train, tram, etc.)?
(Closed choices are labeled in “days a month” units.)
2.3 Features
| Feature | Meaning | Range |
|---|---|---|
gt_group_ca |
Ground-truth PRCA group-discussion subscale | 6–30 |
gt_interpersonal_ca |
Ground-truth PRCA interpersonal subscale | 6–30 |
2.4 Model & evaluation
- Estimator:
RandomForestClassifier(500 trees,min_samples_leaf=3,class_weight="balanced"), features z-scored in a pipeline - Validation: stratified 5-fold CV; out-of-fold predicted probabilities
- Primary metrics: ROC-AUC, average precision, balanced accuracy, F1, Brier score
- Comparators:
- Chance / prevalence baseline (ROC-AUC = 0.5)
- Group-CA-only RF
- Interpersonal-CA-only RF
- Interpretation aids: point-biserial associations, Gini + permutation importance, probability surface over CA space
3 Results
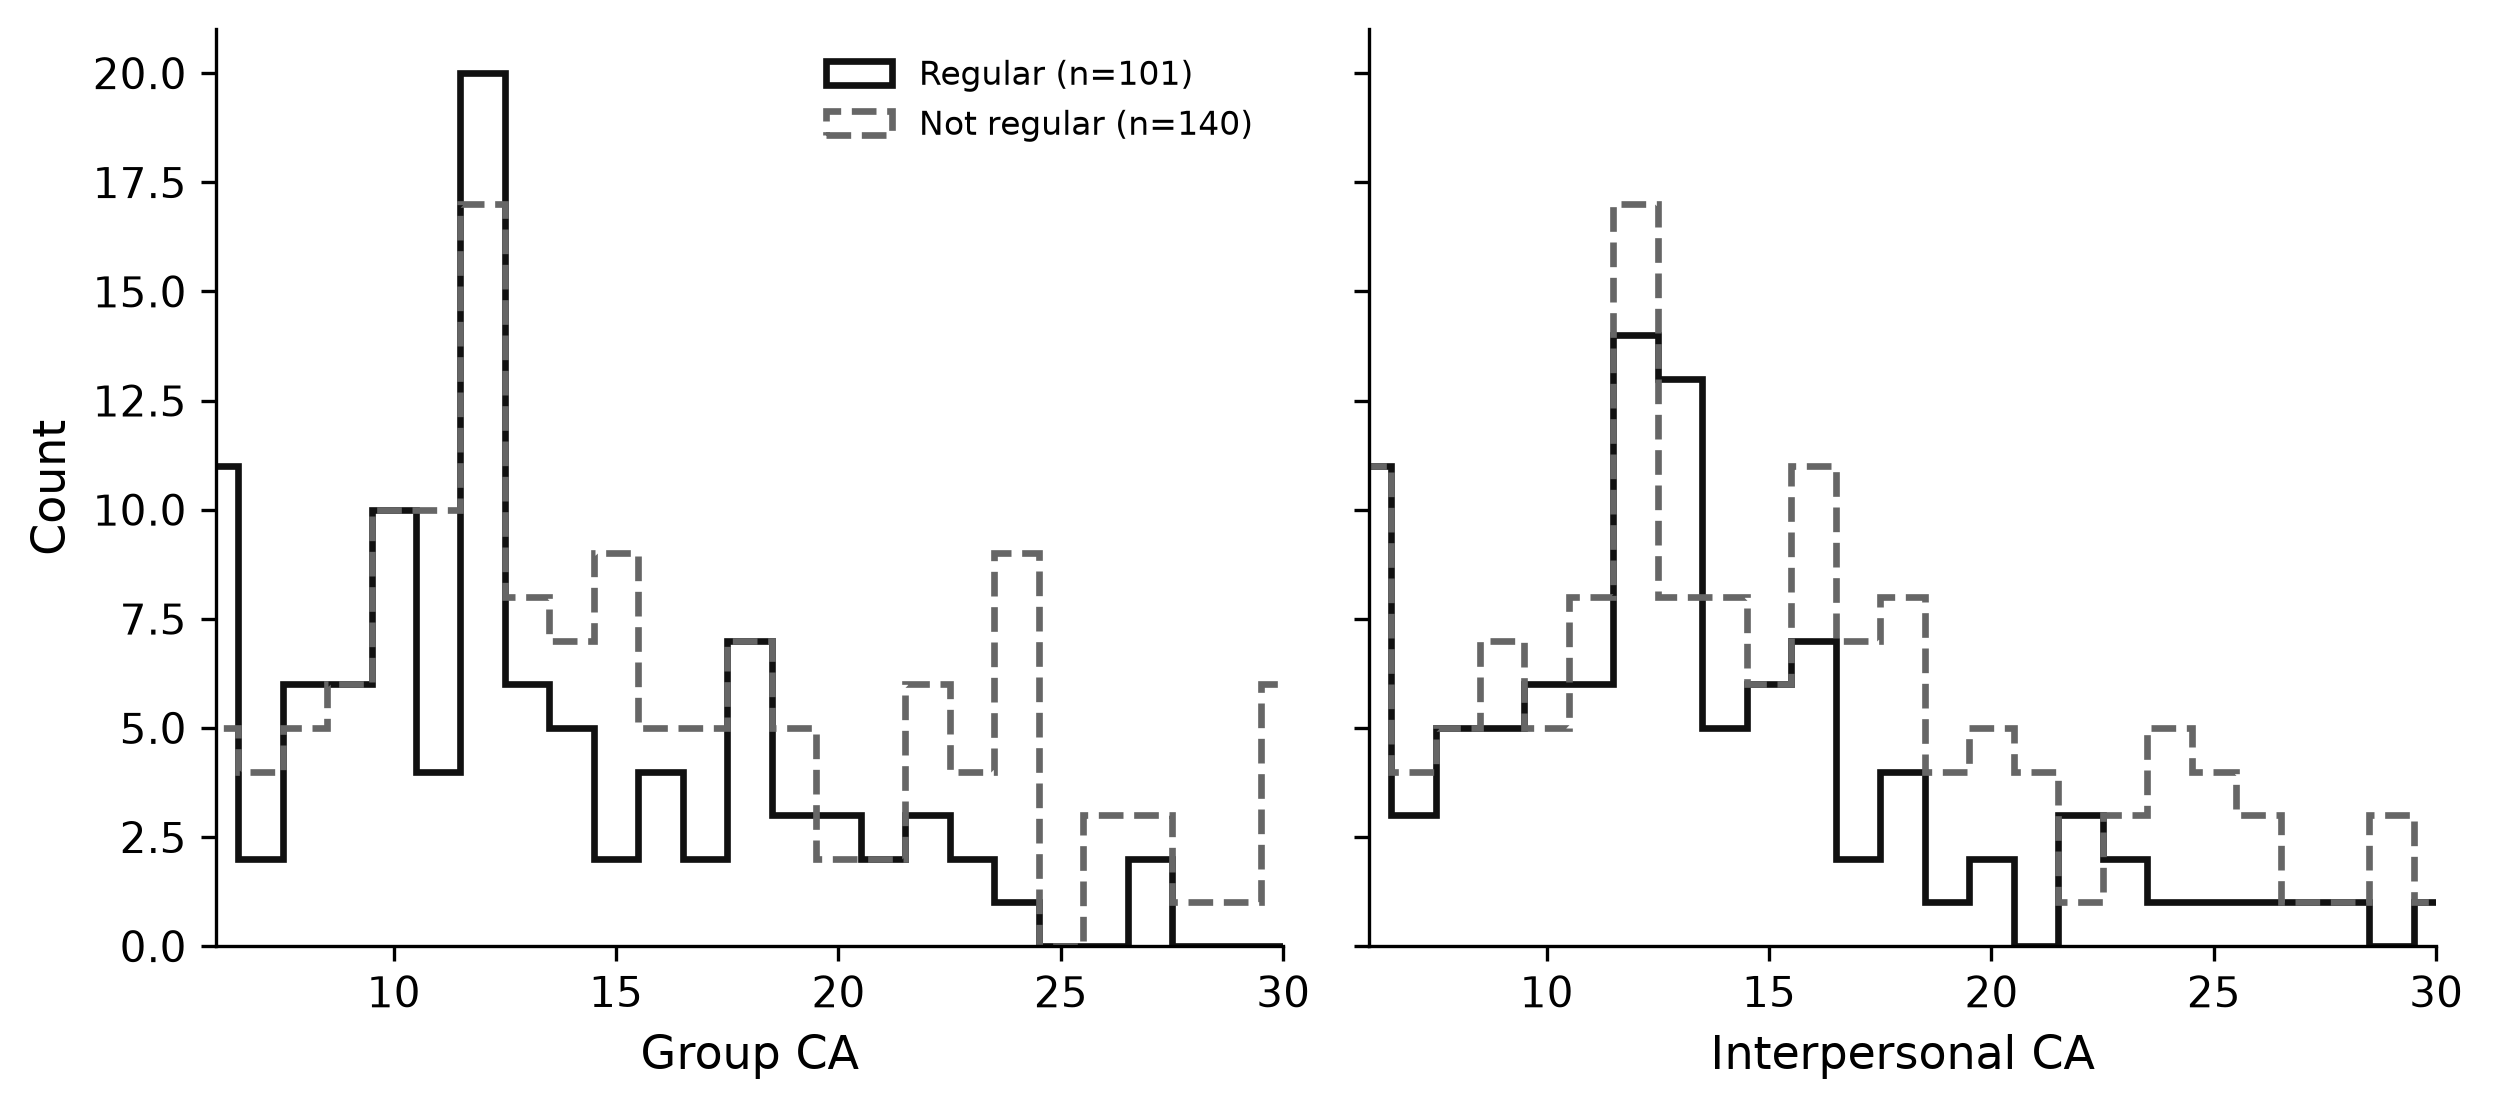
3.1 Descriptive associations
Regular riders report lower CA than non-regular riders on both subscales:
| Subscale | Regular M | Not-regular M | Δ (reg − not) | Point-biserial r | p |
|---|---|---|---|---|---|
| Group CA | 13.04 | 15.76 | −2.72 | −0.223 | 0.0005 |
| Interpersonal CA | 13.31 | 15.04 | −1.73 | −0.147 | 0.023 |
Both associations are statistically significant at α = .05. The group subscale shows the larger mean gap and stronger correlation with regular transit.
3.2 Random Forest predictive performance
| Model | ROC-AUC | Avg. precision | Balanced accuracy | F1 |
|---|---|---|---|---|
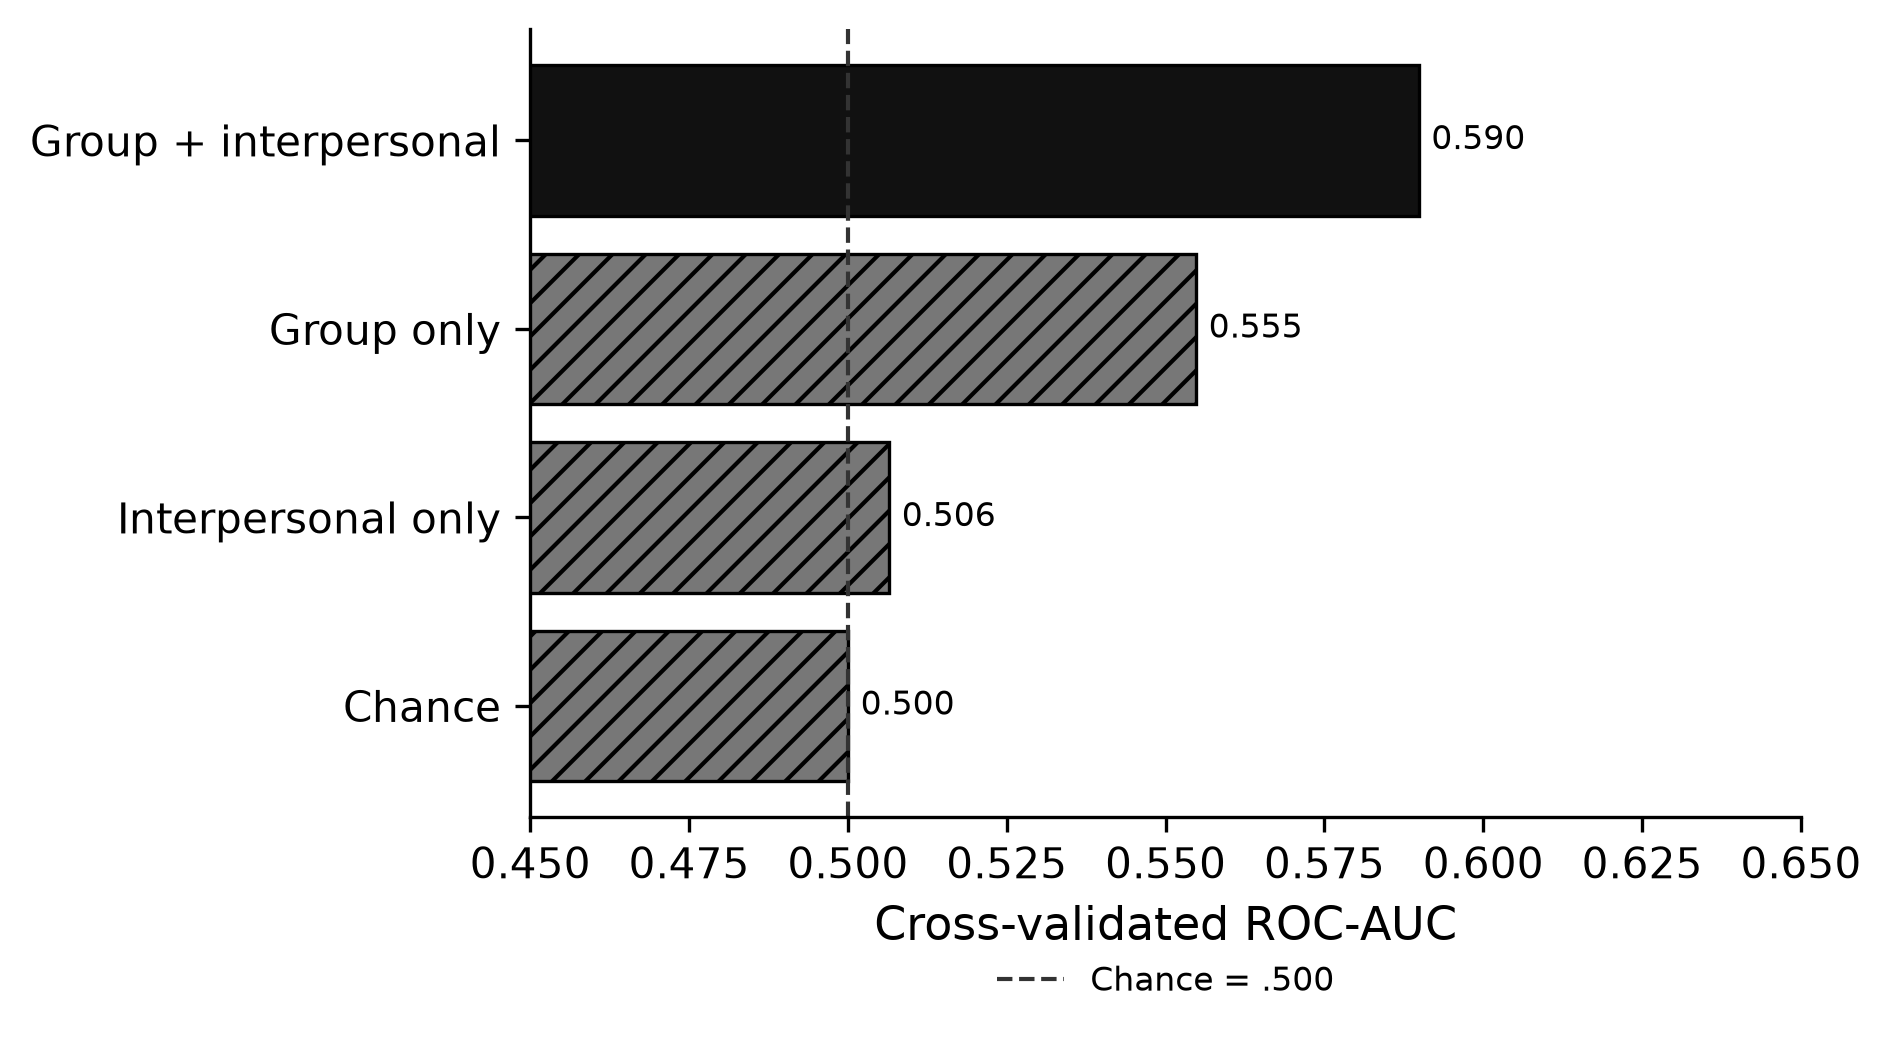
| Group + interpersonal RF | 0.590 | 0.483 | 0.573 | 0.540 |
| Group CA only | 0.555 | — | — | — |
| Interpersonal CA only | 0.506 | — | — | — |
| Chance / prevalence | 0.500 | 0.419 | 0.500 | — |
At a 0.5 probability threshold, the primary model’s out-of-fold confusion counts were TN=76, FP=64, FN=40, TP=61.
3.3 Which subscale matters more?
- Single-feature AUCs and permutation importance both rank group CA above interpersonal CA.
- Combining both subscales lifts ROC-AUC by about +0.035 over the better single-feature model (group only).
4 Interpretation
Yes — CA scores carry above-chance predictive information about regular public-transit use in this matched cohort (CV ROC-AUC = 0.590).
Direction. Higher communication apprehension is associated with lower probability of weekly+ public transit. Regular riders sit roughly 1.7–2.7 PRCA points lower than non-regular riders, with the larger gap on the group subscale.
Magnitude of predictive power. A CV ROC-AUC of 0.590 beats chance by +0.090 and geo by +0.039, but trails Q28 (0.762) by −0.172 (memo). OOF confusion (TN=76, FP=64, FN=40, TP=61) shows substantial overlap.
Group vs interpersonal. Group CA is the larger contributor (single-feature AUC = 0.555 vs 0.506; permutation mean AUC drop = 0.309 vs 0.223). Adding interpersonal CA lifts AUC by +0.035 over group only.
Link to other secondary RQs.
- Transit → CA (
transit_ca; memo): regular riders differ in mean CA (group Δ = −2.72); this RQ shows that difference translates into AUC = 0.590 out-of-sample. - Geo → transit (
geo_transit_rf; memo): lat/long alone yielded ROC-AUC = 0.551. CA subscales here yield AUC = 0.590.
- Transit → CA (
Implication for the primary persona project. When LLM persona tiers include transit information, the model is being given a cue empirically related to true CA (group Δ = −2.72 among regular riders; memo).
5 Limitations
- Same-wave association. CA and transit were collected together; reverse causality and third-variable confounding remain plausible.
- Coarse outcome. Weekly+ vs not discards ridership intensity within the regular group.
- Self-report. Both PRCA and
Q26are self-reported. - External validity. Results describe this Prolific/Qualtrics matched cohort only.
6 Reproducibility
ca-personas ca-transit-rf --join inner
jupyter nbconvert --to notebook --execute notebooks/secondary_rq_ca_transit_rf.ipynb
Key outputs:
outputs/ca_transit_rf/ca_transit_rf_results_card.json— compact verdict for slidesoutputs/ca_transit_rf/ca_transit_rf_metrics.csv— full metric tableoutputs/ca_transit_rf/fig_*.png— presentation figures