Memo: Do regular transit riders differ in CA?
Research memorandum — observational PRCA contrast
Research question: Do individuals who take public transportation regularly have communication-apprehension (CA) scores that differ from non-regular riders in the matched cohort?
Formal write-up: docs/secondary_rq_transit_ca.md
1 Answer, Response, + Summary of Results
Using the Prolific↔︎Qualtrics matched cohort (File A + File B stacked joined to File C; 252 matched rows; analytic n = 241 with complete PRCA items), we compared ground-truth group and interpersonal communication apprehension (CA; range 6–30; (McCroskey, 1970)) for regular public-transit riders vs everyone else. Regular transit = Q26 ∈ {4–8 days a month, 8 or more days a month} (weekly-or-more). Primary test: Welch t; effect sizes Cohen’s d / Hedges’ g; ****bootstrap 95% CIs**** (ca-personas transit-ca --join inner --seed 42).
Short answer: Yes. Regular riders report lower CA on both subscales (see Figure 1). Group CA shows the clearer gap (Δ = −2.72, d = −0.46, p = .0003); interpersonal CA is smaller but still significant (Δ = −1.73, d = −0.30, p = .020).
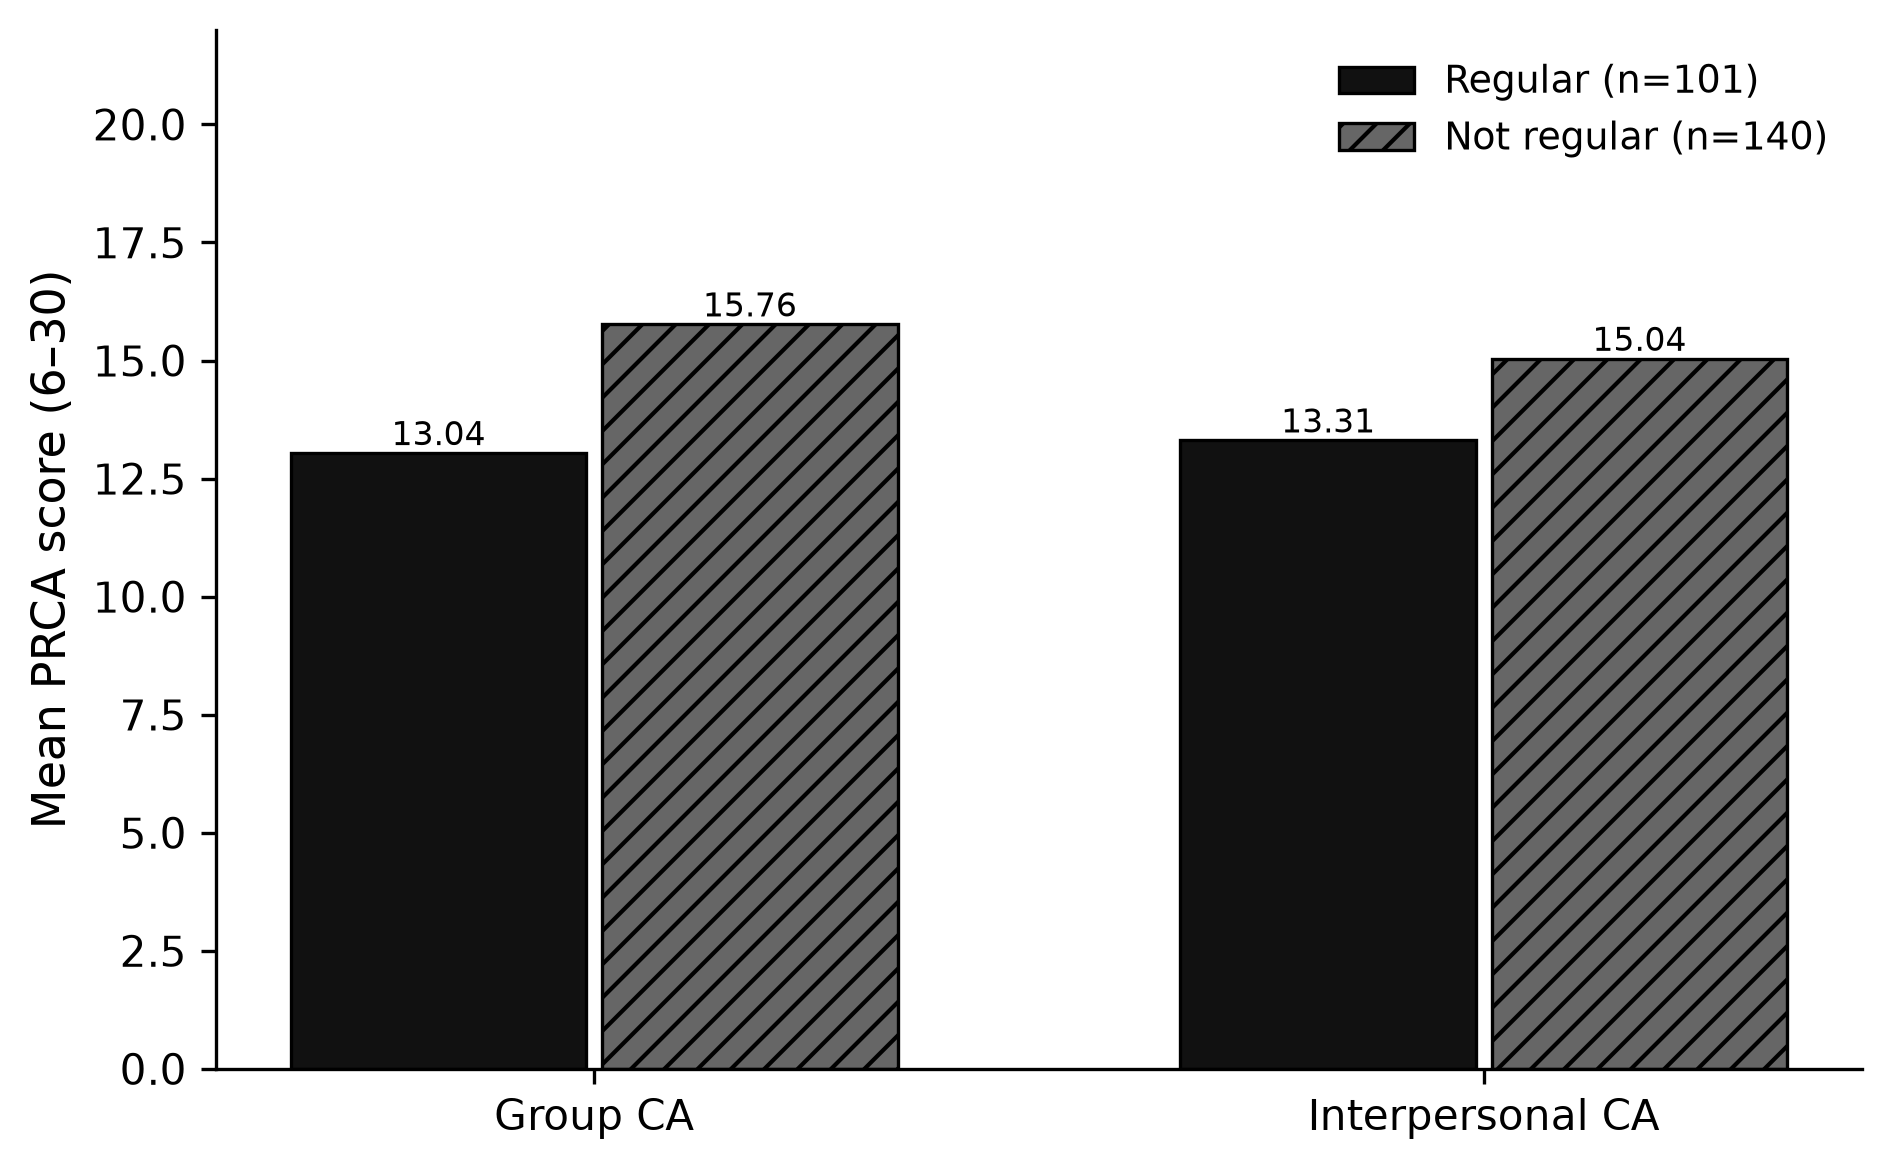
Q26 ridership and regular vs not-regular
Key numbers (regular n = 101 vs not-regular n = 140; Table Table 1):
| Subscale | Regular M | Not-regular M | Δ | Welch p | Cohen’s d |
|---|---|---|---|---|---|
| Group CA | 13.04 | 15.76 | −2.72 | 0.0003 | −0.46 |
| Interpersonal CA | 13.31 | 15.04 | −1.73 | 0.020 | −0.30 |
Mean CA also falls as Q26 intensity rises (“Never” group CA M = 17.38; “8 or more days/month” M = 12.84).
Conclusion. Weekly+ public-transit use is associated with lower PRCA scores in this sample — especially group CA (Δ = −2.72, d = −0.46). That group difference is consistent with the companion CA→transit Random Forest (AUC = 0.590; ca_scores_predict_transit.qmd).
Sources: notebooks/secondary_rq_transit_ca.ipynb · src/ca_personas/transit_ca.py · write-up docs/secondary_rq_transit_ca.md · github.com/Exios66/psych755-jjb
2 What questions or uncertainties remain?
Is lower CA a cause of transit use, a consequence of routine shared-vehicle exposure, or a correlate of urbanicity / car access / employment? Same-wave data cannot decide. Whether the CA gap survives after accounting for ride-share exposure is tested in the follow-up residual_ca_after_rideshare.qmd (CA adds only +0.021 AUC over Q28; the within-Q28-strata CA gap is heterogeneous).
3 What other features may also well-predict regular public transit use?
Geography recovers AUC = 0.551 (geo_predicts_transit.qmd); CA scores jointly recover AUC = 0.590 (ca_scores_predict_transit.qmd). Head-to-head mobility follow-ups report car access AUC = 0.607, employment AUC = 0.528, and Q28 AUC = 0.762 (transit_covariate_followups.qmd; q27_q28_predict_transit.qmd).