Memo: Do CA scores predict regular transit?
Research memorandum — group & interpersonal PRCA
Research question: Do group and interpersonal communication-apprehension (PRCA) scores predict whether an individual takes public transportation regularly?
Formal write-up: docs/secondary_rq_ca_predicts_transit.md
1 Answer, Response, + Summary of Results
Using the Prolific↔︎Qualtrics matched cohort for this project (File A + File B stacked joined to File C on Prolific ID / Q0; 252 matched rows; analytic n = 241 with complete scorable PRCA items and usable Q26), we asked whether ground-truth group and interpersonal CA scores (range 6–30) predict regular public-transit use, defined as Q26 ∈ {4–8 days a month, 8 or more days a month} (weekly-or-more). A balanced Random Forest ((Breiman, 2001); implemented via scikit-learn (Pedregosa et al., 2011)) (stratified 5-fold CV, random_state=42) was trained on the two CA subscales, with group-only and interpersonal-only ablations and a chance baseline (ROC-AUC = 0.50).
Figures below match the formal write-up docs/secondary_rq_ca_predicts_transit.md and the seeded CLI artifacts under outputs/ca_transit_rf/ (ca-personas ca-transit-rf --join inner --seed 42).
Short answer: Yes. Higher CA is associated with lower odds of regular transit, and a CA-only Random Forest recovers above-chance discrimination (CV ROC-AUC = 0.590; group-only = 0.555; interpersonal-only = 0.506). Group CA is the larger contributor (permutation mean \(\Delta\)AUC = 0.309 vs 0.223). Figure Figure 1 shows the mean-CA gap alongside the Random Forest ROC curve.
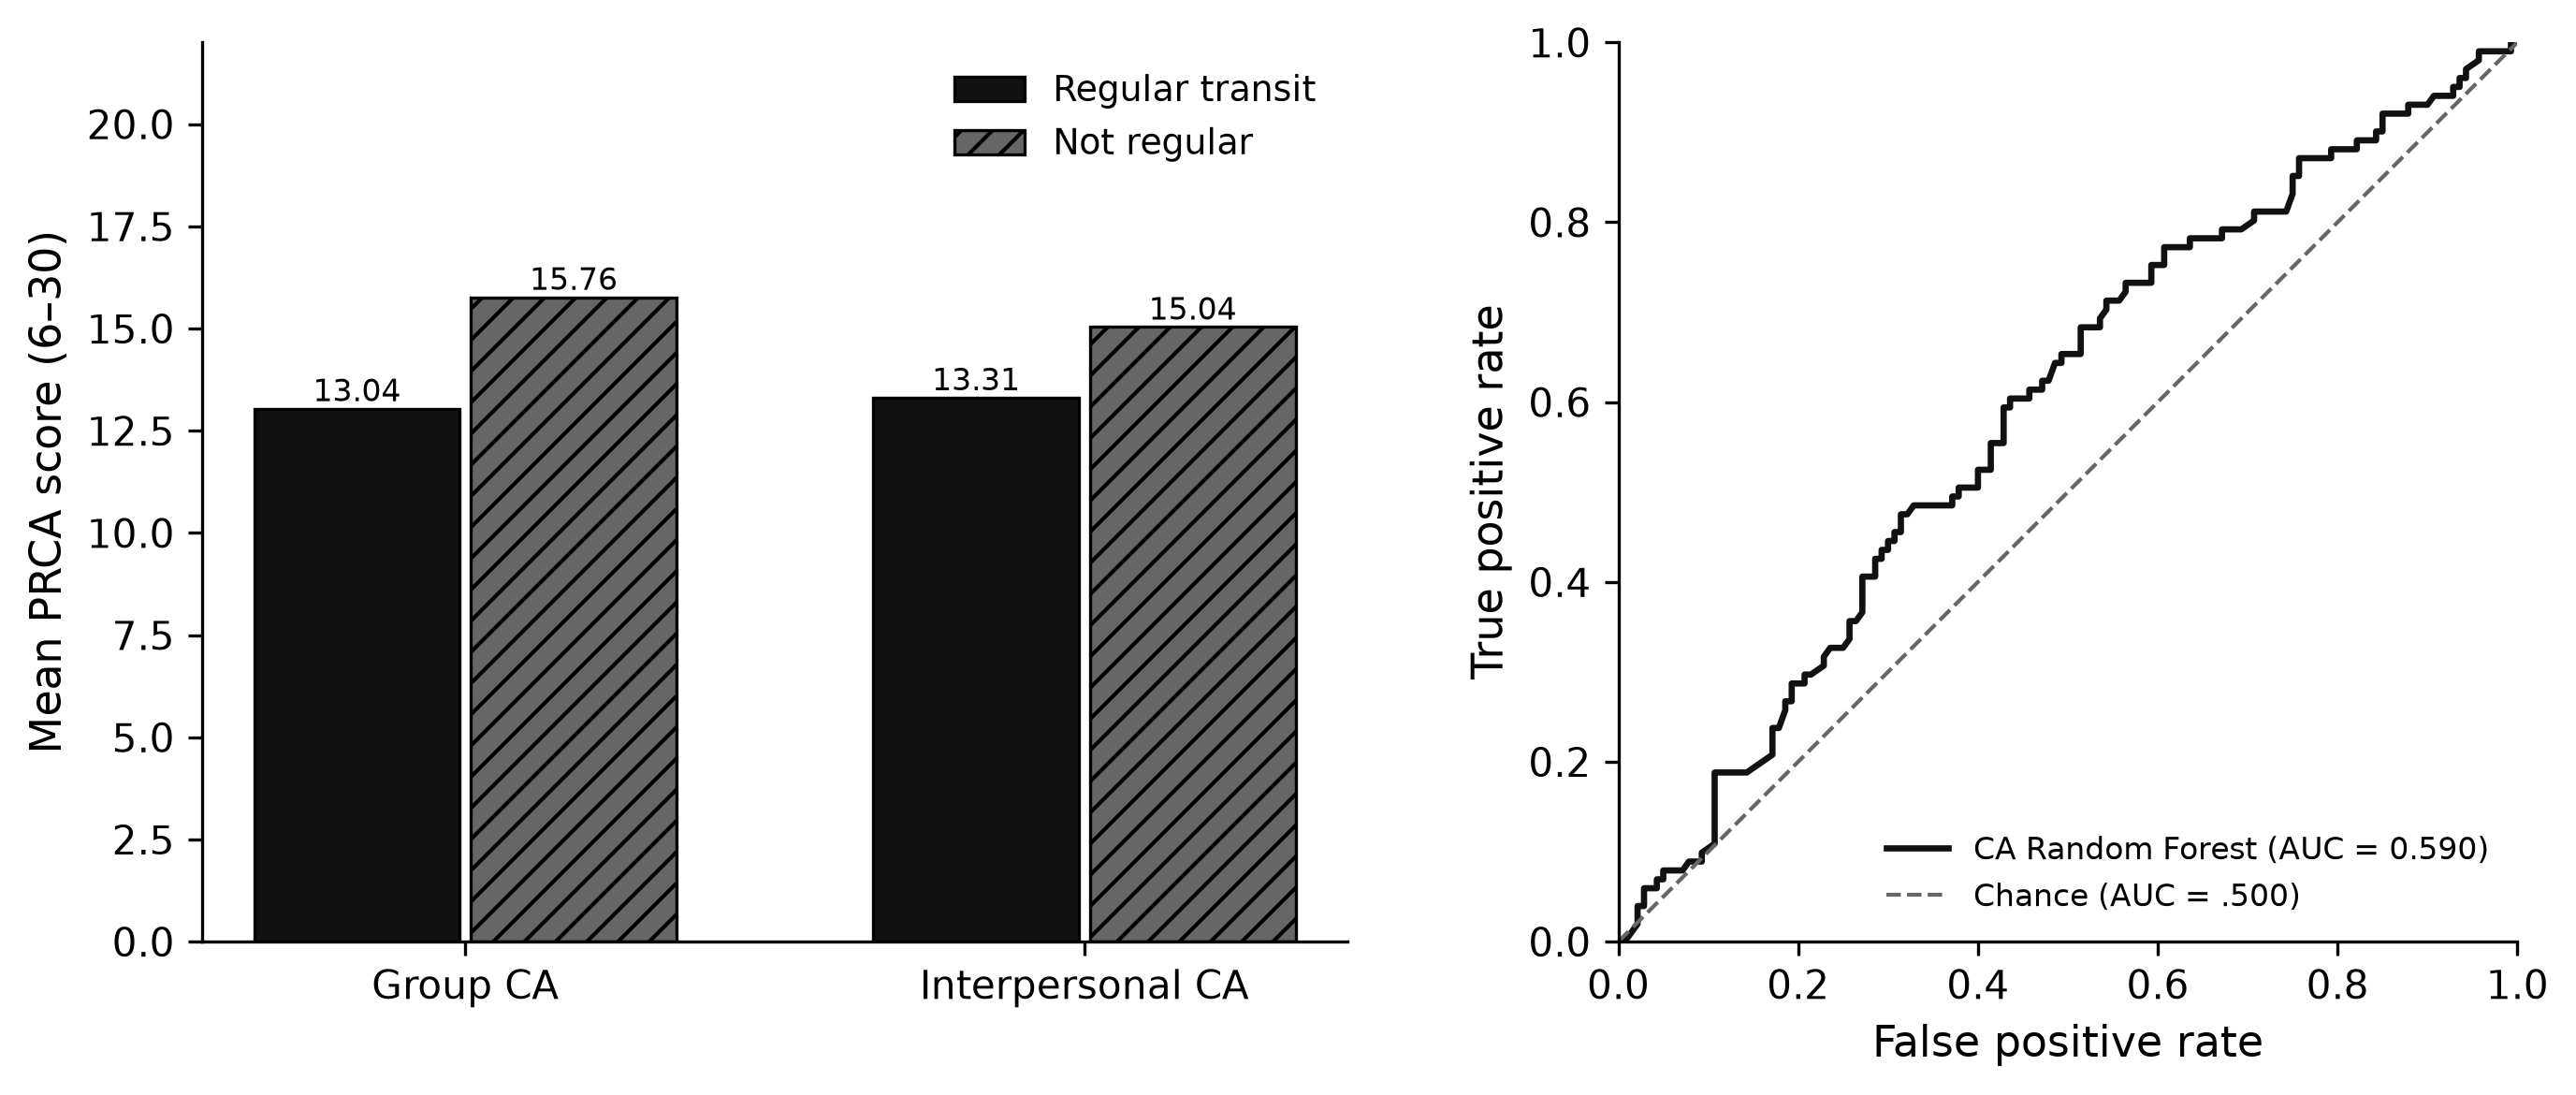
Descriptive associations (regular vs not-regular). Regular riders (n = 101) report lower CA than non-regular riders (n = 140):
- Group CA: M = 13.04 vs 15.76 (Δ = −2.72); point-biserial r = −0.223, p = 0.0005
- Interpersonal CA: M = 13.31 vs 15.04 (Δ = −1.73); point-biserial r = −0.147, p = 0.023
Random Forest (stratified CV). Predicting regular transit from CA scores (see Table Table 1):
| Model | ROC-AUC |
|---|---|
| Group + interpersonal CA | 0.590 |
| Group CA only | 0.555 |
| Interpersonal CA only | 0.506 |
| Chance | 0.500 |
Permutation importance likewise ranks group CA above interpersonal CA. Combining both subscales improves AUC by about +0.035 over the better single-feature model.
Conclusion. Group and interpersonal CA recover CV ROC-AUC = 0.590 for weekly+ transit — above chance (+0.090) and above geo (0.551), but below Q28 (0.762; q27_q28_predict_transit.qmd). The relationship is consistent in direction (higher apprehension ↔︎ less weekly+ transit) and is driven more by group than interpersonal CA. CA alone does not separate riders cleanly (OOF confusion TN = 76, FP = 64, FN = 40, TP = 61), so treat these scores as a behavioral correlate, not a deterministic proxy.
Sources: notebooks/secondary_rq_ca_transit_rf.ipynb · src/ca_personas/ca_transit_rf.py · ca-personas ca-transit-rf · write-up docs/secondary_rq_ca_predicts_transit.md · github.com/Exios66/psych755-jjb
2 What questions or uncertainties remain?
Is the CA–transit link causal (e.g., anxiety reducing use of shared vehicles), reverse (transit exposure reducing apprehension), or driven by third variables such as urbanicity, car access, employment, or country of residence? Same-wave self-reports cannot separate these accounts.
Answered in follow-ups: residual CA after stratifying on Q28 is residual_ca_after_rideshare.qmd (CA adds only +0.021 AUC over Q28); CA + Q28 + car on a complete-case frame is ca_mobility_joint_predicts_transit.qmd (joint 0.736); the multiply-imputed head-to-head is mi_head_to_head.qmd (CA not restored to competitive levels).
3 What other features may also well-predict regular public transit use?
Survey geolocation recovers AUC = 0.551 (geo_predicts_transit.qmd). Head-to-head mobility follow-ups: ride-share family Q28/Q29 AUC = 0.745, car access Q20/Q21 AUC = 0.607, employment AUC = 0.528, Q28 alone AUC = 0.762 — see transit_covariate_followups.qmd and q27_q28_predict_transit.qmd.