Memo: Do car license & access predict regular transit?
Research memorandum — Q20/Q21 follow-up to the geography memo
Research question: Do driver’s license (Q20) and car access (Q21) predict whether a matched respondent takes public transportation regularly?
Parent memo: geo_predicts_transit.qmd
Comparison memo: transit_covariate_followups.qmd
1 Answer, Response, + Summary of Results
Using the Prolific↔︎Qualtrics matched cohort (File A + File B stacked joined to File C; analytic PRCA sample ((McCroskey, 1970); n = 241), we tested the geo-memo follow-up candidate car license / car access. Regular transit is Q26 ∈ {4–8 days a month, 8 or more days a month}. Because Q20/Q21 are missing for many respondents, the complete-case modeling frame is n = 149 (58 regular / 91 not regular; prevalence = 38.9%). A balanced Random Forest ((Breiman, 2001)) with stratified 5-fold CV (seed=42) used Q20 and Q21 as one-hot features.
Short answer: Yes — car license/access exceeds geography and CA on CV ROC-AUC. Car license/access recovers CV ROC-AUC = 0.607, above chance (0.500), the geo RF benchmark (0.551), and the CA RF benchmark (0.590). Access (Q21) dominates license (Q20). Figure Figure 1 shows prevalence by level and the ROC curve.
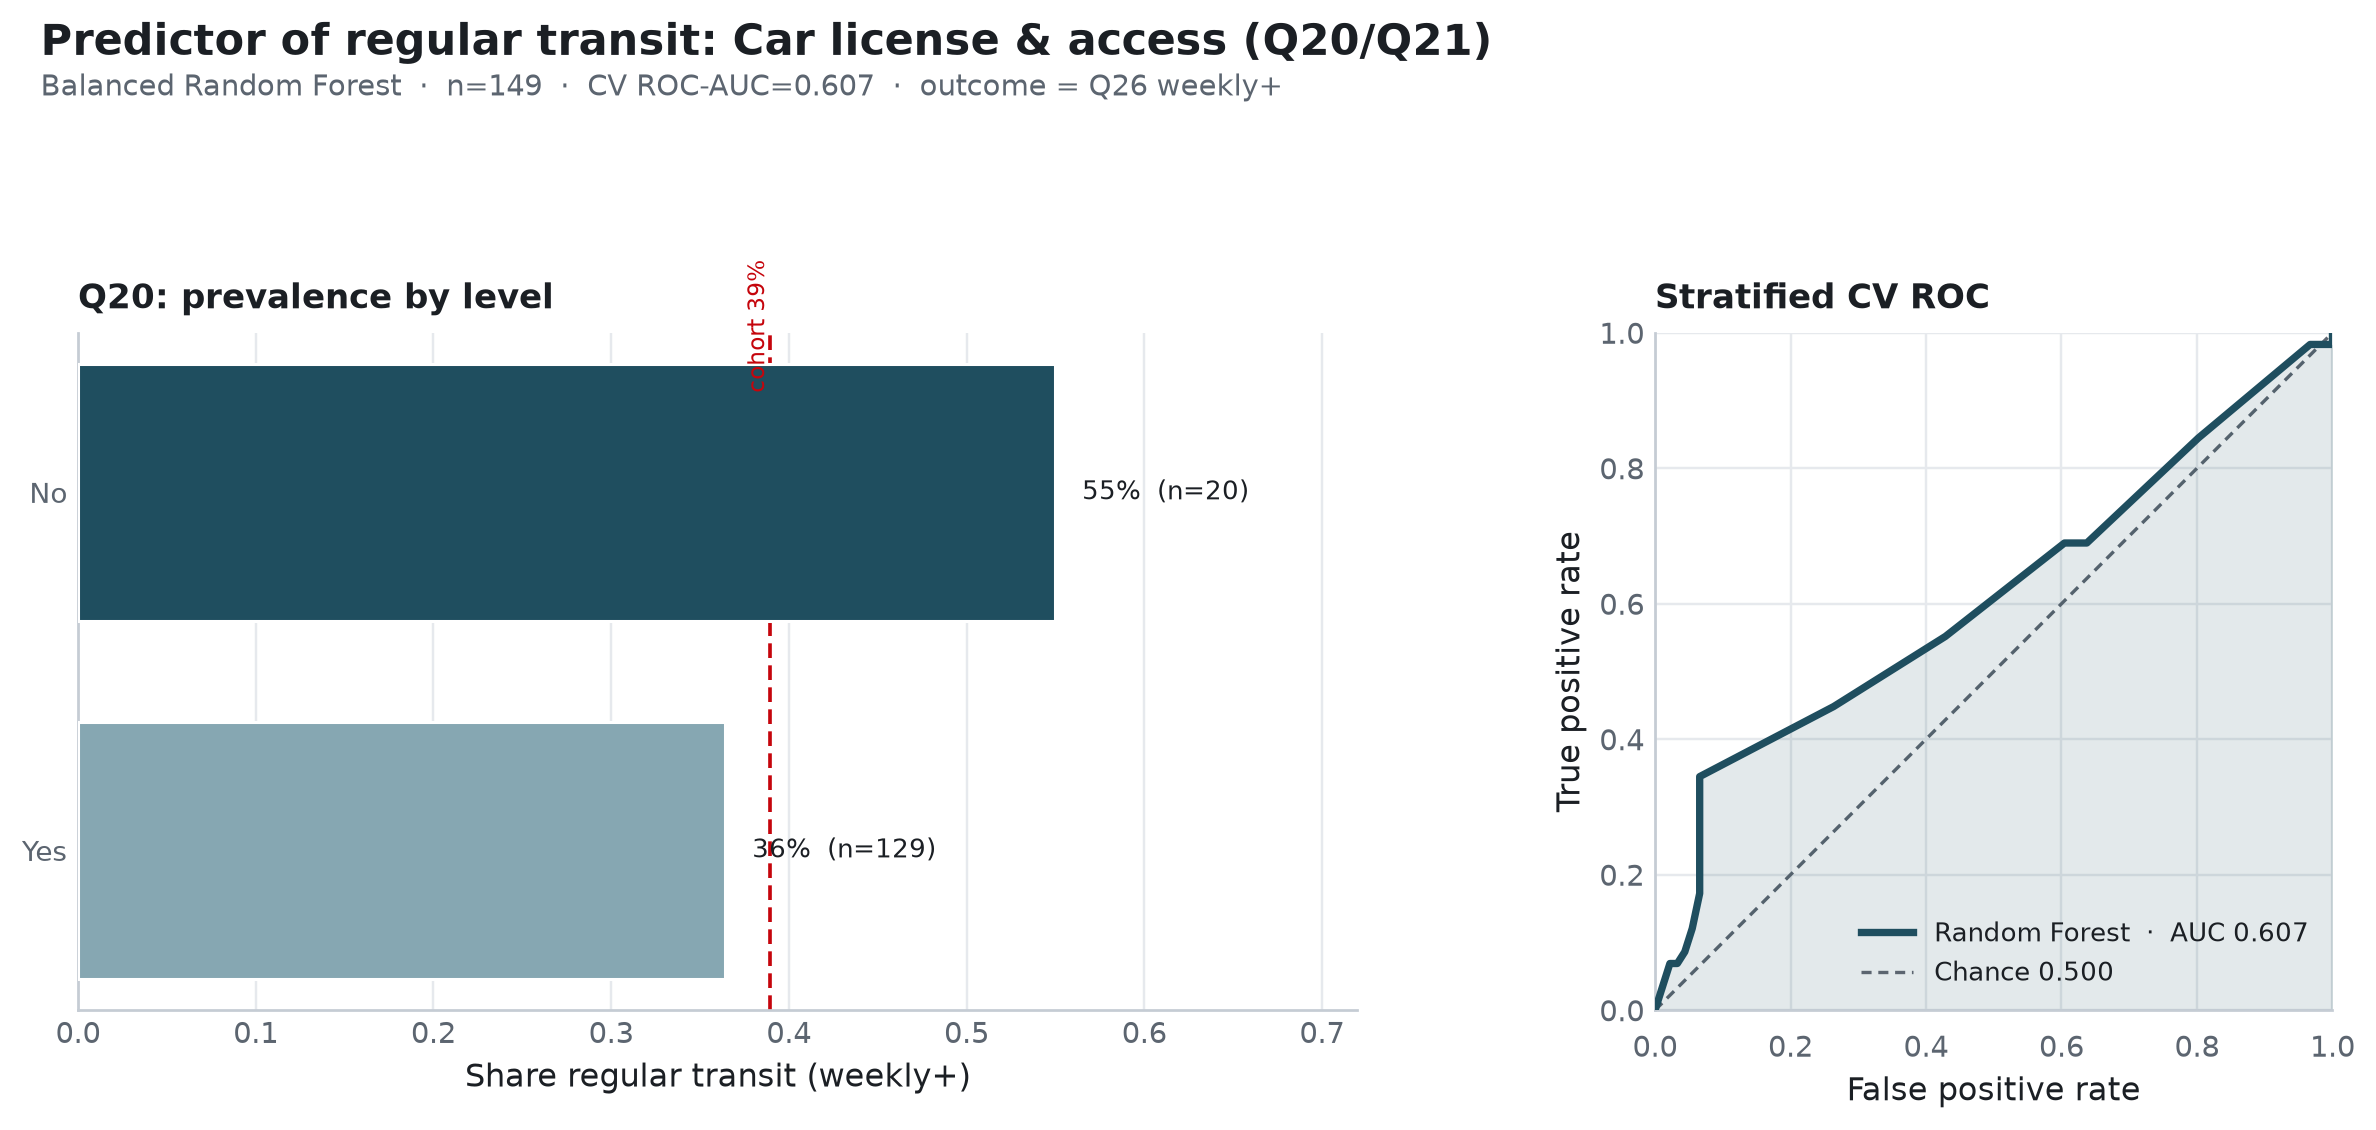
Descriptive associations (complete cases). Respondents without car access ride regularly far more often than those with access (Table Table 1):
| Item | Level | n | % regular |
|---|---|---|---|
Q21 access |
No | 25 | 76.0% |
Q21 access |
Yes | 123 | 30.9% |
Q20 license |
No | 20 | 55.0% |
Q20 license |
Yes | 129 | 36.4% |
Random Forest (stratified CV). Table Table 2 reports the CV ROC-AUCs.
| Model | n | ROC-AUC |
|---|---|---|
Q20 + Q21 RF |
149 | 0.607 |
| CA RF benchmark | 241 | 0.590 |
| Geo RF benchmark | 241 | 0.551 |
| Chance | — | 0.500 |
Permutation importance ranks Q21 (mean \(\Delta\)AUC = 0.182) above Q20 (0.014). At a 0.5 threshold the forest is conservative on the positive class (precision = 0.77, recall = 0.34, F1 = 0.48), consistent with a sparse “no access” positive signal.
Conclusion. Car access recovers AUC = 0.607 on complete cases (n = 149): lacking a usable car is associated with 76.0% regular ridership vs 30.9% among those with access, yet item missingness truncates the analytic N. Interpret as a mobility constraint correlate, not a causal estimate.
Sources: notebooks/secondary_rq_car_access_transit_rf.ipynb · src/ca_personas/transit_covariate_rf.py · ca-personas covariate-transit-rf --specs car_access · github.com/Exios66/psych755-jjb · formal write-up docs/secondary_rq_transit_covariate_followups.md
2 What questions or uncertainties remain?
Are Q20/Q21 missing systematically (e.g., skip logic, survey fatigue), and would imputed or survey-design-aware models change the AUC? Does car access mediate part of the CA–transit or geo–transit associations?
3 What other features may also well-predict regular public transit use?
Ride-share frequency (Q28/Q29) recovers AUC = 0.745 (rideshare_predicts_transit.qmd). Employment status alone recovers AUC = 0.528 (employment_predicts_transit.qmd). Head-to-head: transit_covariate_followups.qmd.