Memo: Does employment status predict regular transit?
Research memorandum — employment follow-up to the geography memo
Research question: Does employment status predict whether a matched respondent takes public transportation regularly?
Parent memo: geo_predicts_transit.qmd
Comparison memo: transit_covariate_followups.qmd
1 Answer, Response, + Summary of Results
Using the full matched analytic cohort (n = 241; 101 regular / 140 not regular), we evaluated Employment status (Full-Time / Part-Time / Other) as a single-feature Random Forest ((Breiman, 2001)) predicting weekly+ public transit (Q26 threshold as in the geo and CA memos). Stratified 5-fold CV, random_state=42.
Short answer: Barely. Employment status yields CV ROC-AUC = 0.528 — only +0.028 above chance and below both the geo (0.551) and CA (0.590) benchmarks. It is not a competitive stand-alone predictor in this sample. Figure Figure 1 shows prevalence by level and the ROC curve.
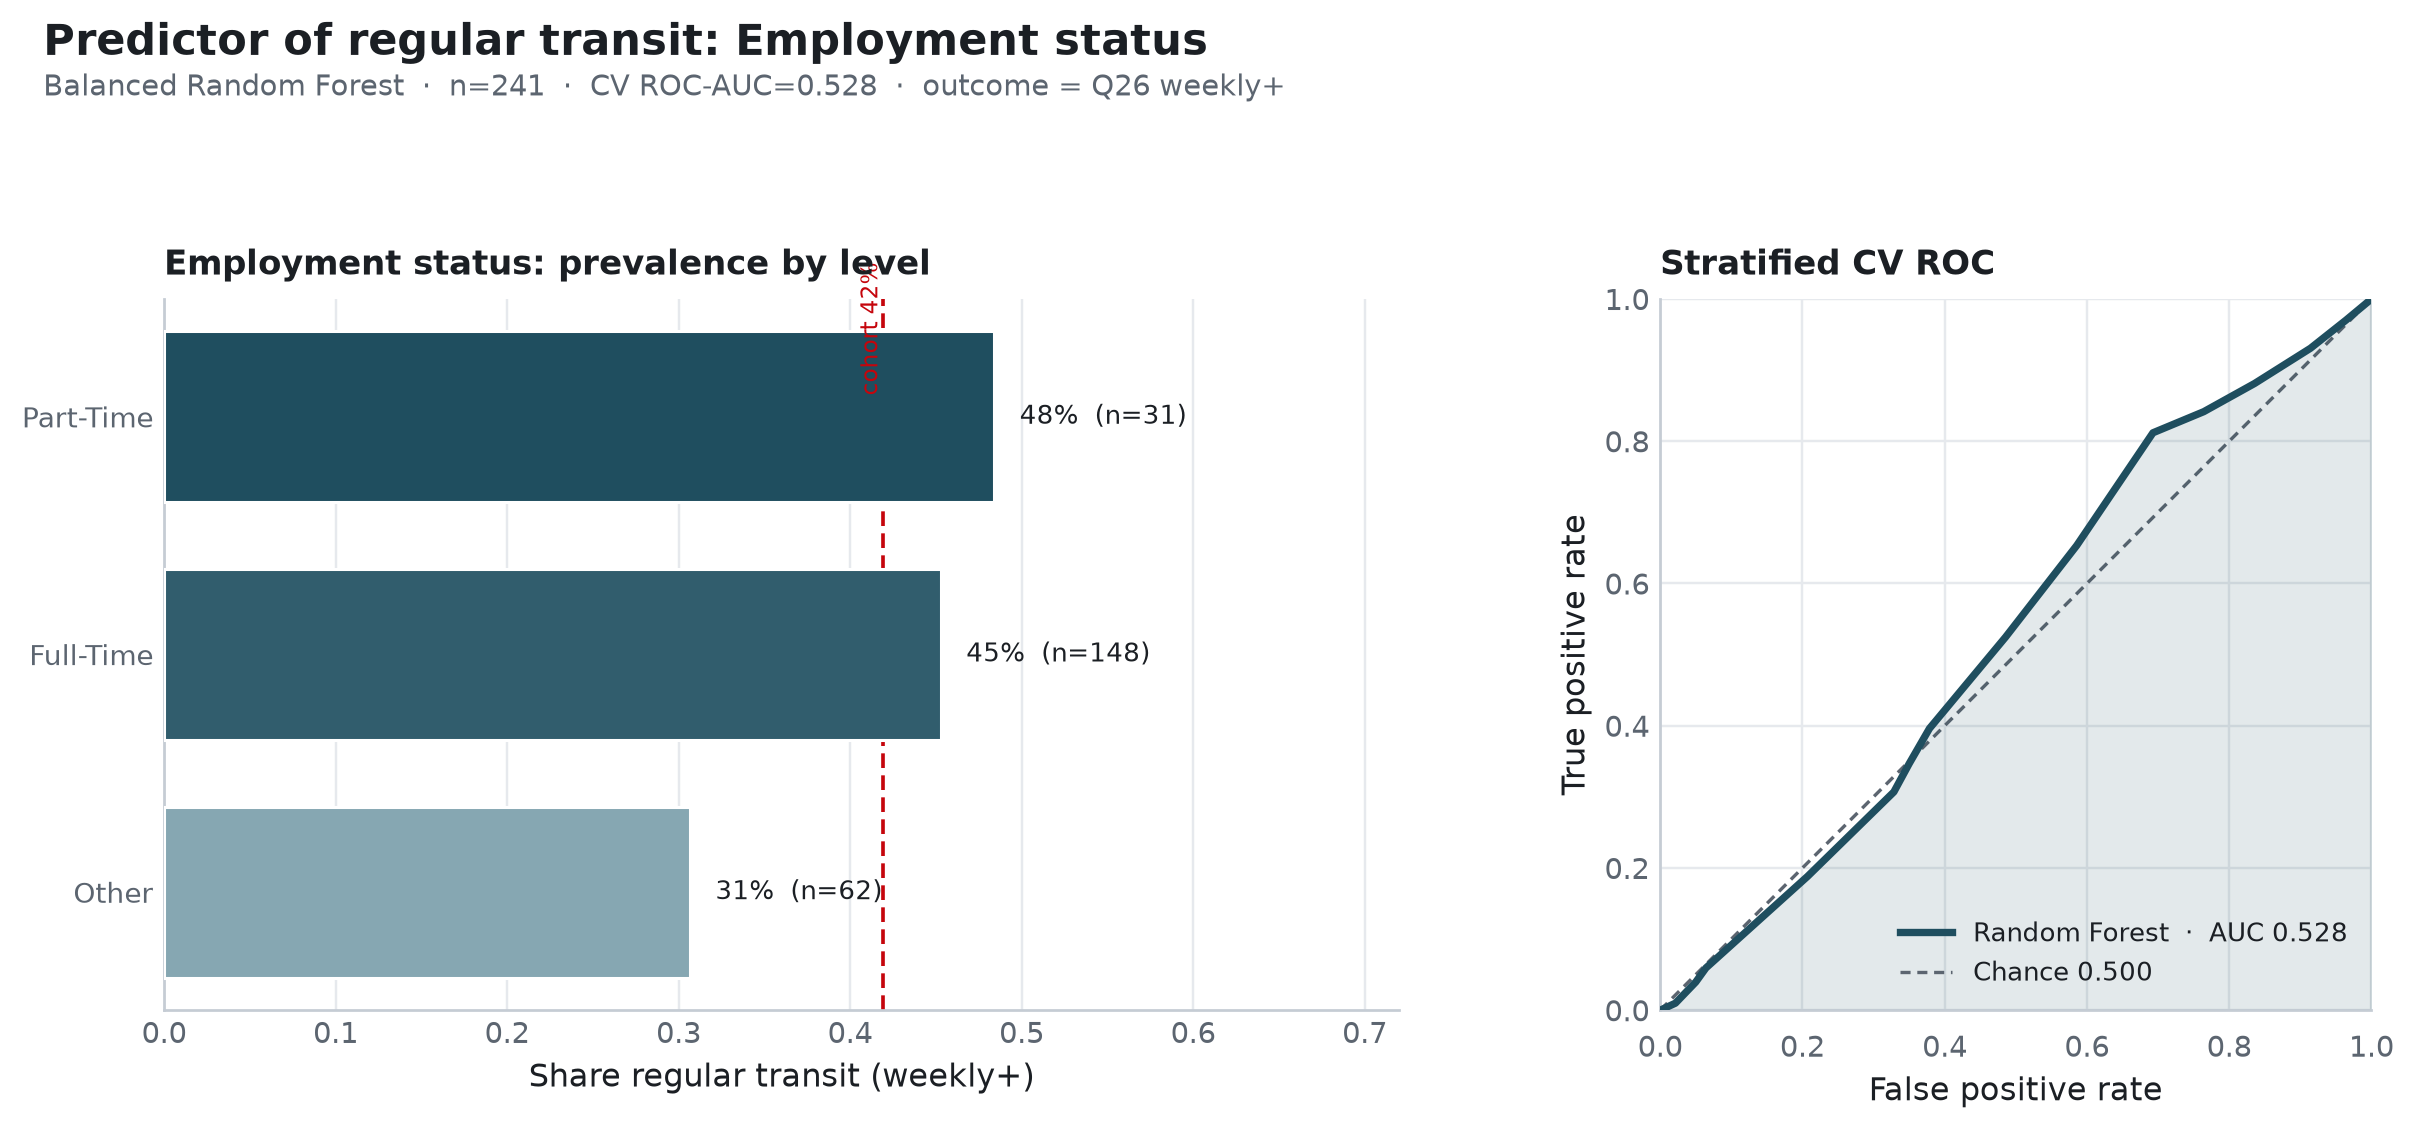
Descriptive associations. Table Table 1 reports employment prevalence.
| Employment status | n | % regular |
|---|---|---|
| Part-Time | 31 | 48.4% |
| Full-Time | 148 | 45.3% |
| Other | 62 | 30.6% |
Part-time and full-time rates are close; the “Other” category is less often regular. With only three coarse levels, discrimination is inherently limited.
Random Forest (stratified CV). Table Table 2 reports the CV ROC-AUCs.
| Model | n | ROC-AUC |
|---|---|---|
| Employment status RF | 241 | 0.528 |
| Geo RF benchmark | 241 | 0.551 |
| CA RF benchmark | 241 | 0.590 |
| Chance | — | 0.500 |
Balanced accuracy = 0.560 and Brier = 0.247. Permutation importance mean \(\Delta\)AUC = 0.059.
Conclusion. Employment status, as coded in the Prolific export, recovers AUC = 0.528 for weekly+ transit. It remains useful as a control/covariate in multi-feature models, but it does not outperform geography (0.551) or CA (0.590) on its own.
Sources: notebooks/secondary_rq_employment_transit_rf.ipynb · src/ca_personas/transit_covariate_rf.py · ca-personas covariate-transit-rf --specs employment · github.com/Exios66/psych755-jjb · formal write-up docs/secondary_rq_transit_covariate_followups.md
2 What questions or uncertainties remain?
Would finer employment categories (student, gig work, remote vs on-site) recover more signal? Does employment interact with car access or urbanicity rather than acting as a main effect?
3 What other features may also well-predict regular public transit use?
Ride-share (Q28/Q29) recovers AUC = 0.745 and car access (Q20/Q21) recovers AUC = 0.607; see rideshare_predicts_transit.qmd and car_access_predicts_transit.qmd.