On the Prolific↔︎Qualtrics matched analytic sample (no LLM):
Do individuals who take public transportation regularly differ in group CA from non-regular riders?
Do they differ in interpersonal CA?
How large are those differences relative to the overall cohort mean, and are they sensitive to the Q26 cutoff used to define “regular”?
These questions establish the descriptive association that later predictive models (CA→transit RF; geo→transit RF) quantify out of sample.
2 Methods
2.1 Sample
Sources: Prolific File A + File B (stacked) joined to Qualtrics File C on Q0 ↔︎ Participant id
Analytic N: 241 respondents with complete PRCA group + interpersonal items
Exposure labeled N: 241 with usable Q26 (101 regular / 140 not regular)
2.2 Exposure
Regular public transit = Q26 ∈ {4-8 days a month, 8 or more days a month} (weekly-or-more).
2.3 Outcomes & tests
Piece
Detail
Outcomes
gt_group_ca, gt_interpersonal_ca (PRCA 6–30)
Primary test
Welch t (unequal variances)
Sensitivity
Mann–Whitney U; bootstrap 95% CI for mean difference
Effect size
Cohen’s d, Hedges’ g
Extra contrasts
Regular mean vs overall cohort mean; alternate Q26 cutoffs
3 Results
3.1 Primary contrast (regular vs not-regular)
CA distributions by transit group
Subscale
Regular M
Not-regular M
Δ (reg − not)
Welch p
Cohen’s d
Bootstrap 95% CI
Group CA
13.04
15.76
−2.72
0.0003
−0.46
[−4.15, −1.28]
Interpersonal CA
13.31
15.04
−1.73
0.020
−0.30
[−3.12, −0.25]
Both subscales differ significantly at α = .05. Group CA shows the larger mean gap (small–medium d); interpersonal CA is a small effect.
Mean CA by Q26 and regular vs not
Relative to the overall cohort mean (group 14.62; interpersonal 14.31), regular riders sit about −1.58 / −1.00 PRCA points lower (−10.8% / −7.0%).
3.2 Gradient by ridership intensity
Mean CA falls roughly monotonically as Q26 ridership increases:
Q26
n
Mean group CA
Mean interpersonal CA
Never
50
17.38
16.34
0–1 days/month
37
15.38
15.16
2–4 days/month
53
14.51
13.72
4–8 days/month
46
13.28
13.48
8+ days/month
55
12.84
13.16
“Never” riders are the high-CA pole; weekly+ riders are the low-CA pole.
3.3 Sensitivity
Alternate definitions of “regular” (e.g., 8+ only vs weekly+) preserve the direction of the group-CA gap; magnitude and p-values shift with class balance. The weekly+ operationalization used elsewhere in the project is retained as the primary cut.
4 Interpretation
Yes — regular public-transit riders report lower communication apprehension than non-regular riders in this matched cohort.
Direction. Higher CA ↔︎ less weekly+ transit, on both subscales, with a clearer signal for group discussion anxiety (Δ = −2.72, d = −0.46, p = .0003).
Magnitude. Cohen’s d = −0.46 (group) and −0.30 (interpersonal): many high-CA respondents still ride, and many low-CA respondents do not.
Link to other secondary RQs. Mean differences here become the CA→transit Random Forest signal (ROC-AUC = 0.590; memo) and sit beside geo→transit AUC = 0.551 (memo).
Implication for persona tiers. When LLM prompts include transit frequency, they receive a cue empirically associated with true CA — so transit is a legitimate contextual feature, not an arbitrary demographic tag.
5 Limitations
Same-wave association; causality (anxiety → avoid transit, transit → reduce anxiety, or third variables) cannot be separated.
Self-report for both PRCA and Q26.
Weekly+ threshold discards intensity within the regular group.
Results describe this Prolific/Qualtrics matched cohort only.
---title: "Do regular transit riders differ in CA?"subtitle: "Secondary research questions 1–3 — observational contrast"---**Project:** PSYCH 755 — CA persona / PRCA framework **Analysis code:** [`src/ca_personas/transit_ca.py`](../src/ca_personas/transit_ca.py)**Notebook:** [`notebooks/secondary_rq_transit_ca.ipynb`](../notebooks/secondary_rq_transit_ca.ipynb)**CLI:** `ca-personas transit-ca --join inner`**Artifacts:** `outputs/transit_ca/`**Companion memo:** [`memos/transit_riders_ca.qmd`](../memos/transit_riders_ca.qmd)---## Research questionsOn the Prolific↔Qualtrics **matched** analytic sample (no LLM):1. Do individuals who take public transportation **regularly** differ in **group** CA from non-regular riders?2. Do they differ in **interpersonal** CA?3. How large are those differences relative to the overall cohort mean, and are they sensitive to the `Q26` cutoff used to define “regular”?These questions establish the descriptive association that later predictive models (CA→transit RF; geo→transit RF) quantify out of sample.## Methods### Sample- **Sources:** Prolific File A + File B (stacked) joined to Qualtrics File C on `Q0` ↔ `Participant id`- **Analytic N:** 241 respondents with complete PRCA group + interpersonal items- **Exposure labeled N:** 241 with usable `Q26` (101 regular / 140 not regular)### Exposure**Regular public transit** = `Q26` ∈ {`4-8 days a month`, `8 or more days a month`} (weekly-or-more).### Outcomes & tests| Piece | Detail ||---|---|| Outcomes |`gt_group_ca`, `gt_interpersonal_ca` (PRCA 6–30) || Primary test | Welch *t* (unequal variances) || Sensitivity | Mann–Whitney *U*; bootstrap 95% CI for mean difference || Effect size | Cohen's *d*, Hedges' *g* || Extra contrasts | Regular mean vs overall cohort mean; alternate `Q26` cutoffs |## Results### Primary contrast (regular vs not-regular)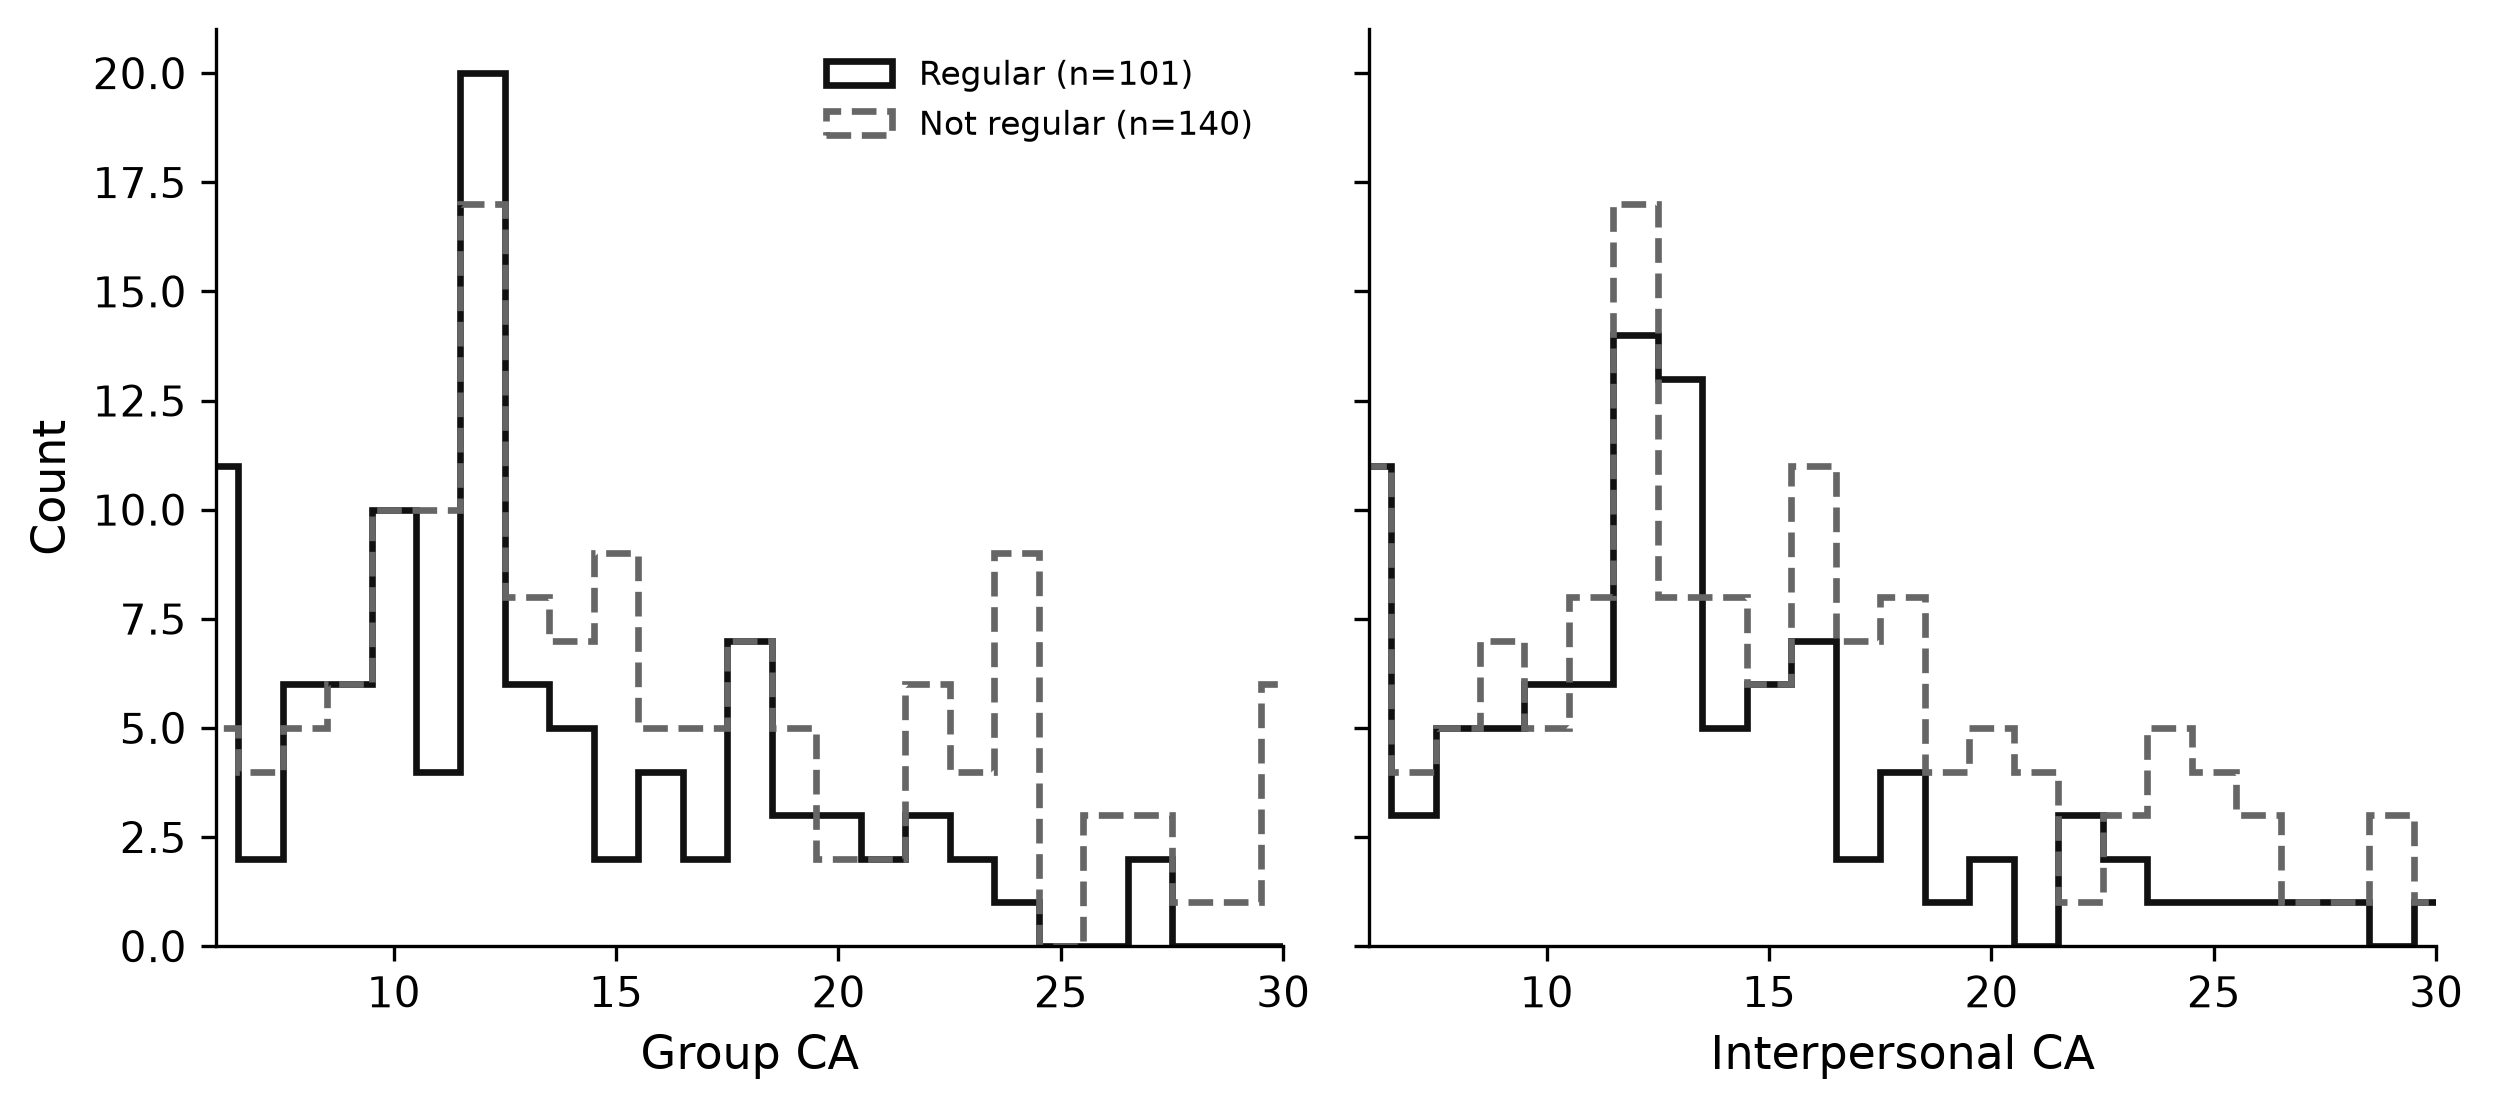| Subscale | Regular M | Not-regular M | Δ (reg − not) | Welch *p* | Cohen's *d* | Bootstrap 95% CI ||---|---:|---:|---:|---:|---:|---|| Group CA | 13.04 | 15.76 | **−2.72** | 0.0003 | −0.46 |[−4.15, −1.28]|| Interpersonal CA | 13.31 | 15.04 | **−1.73** | 0.020 | −0.30 |[−3.12, −0.25]|Both subscales differ significantly at α = .05. Group CA shows the larger mean gap (small–medium *d*); interpersonal CA is a small effect.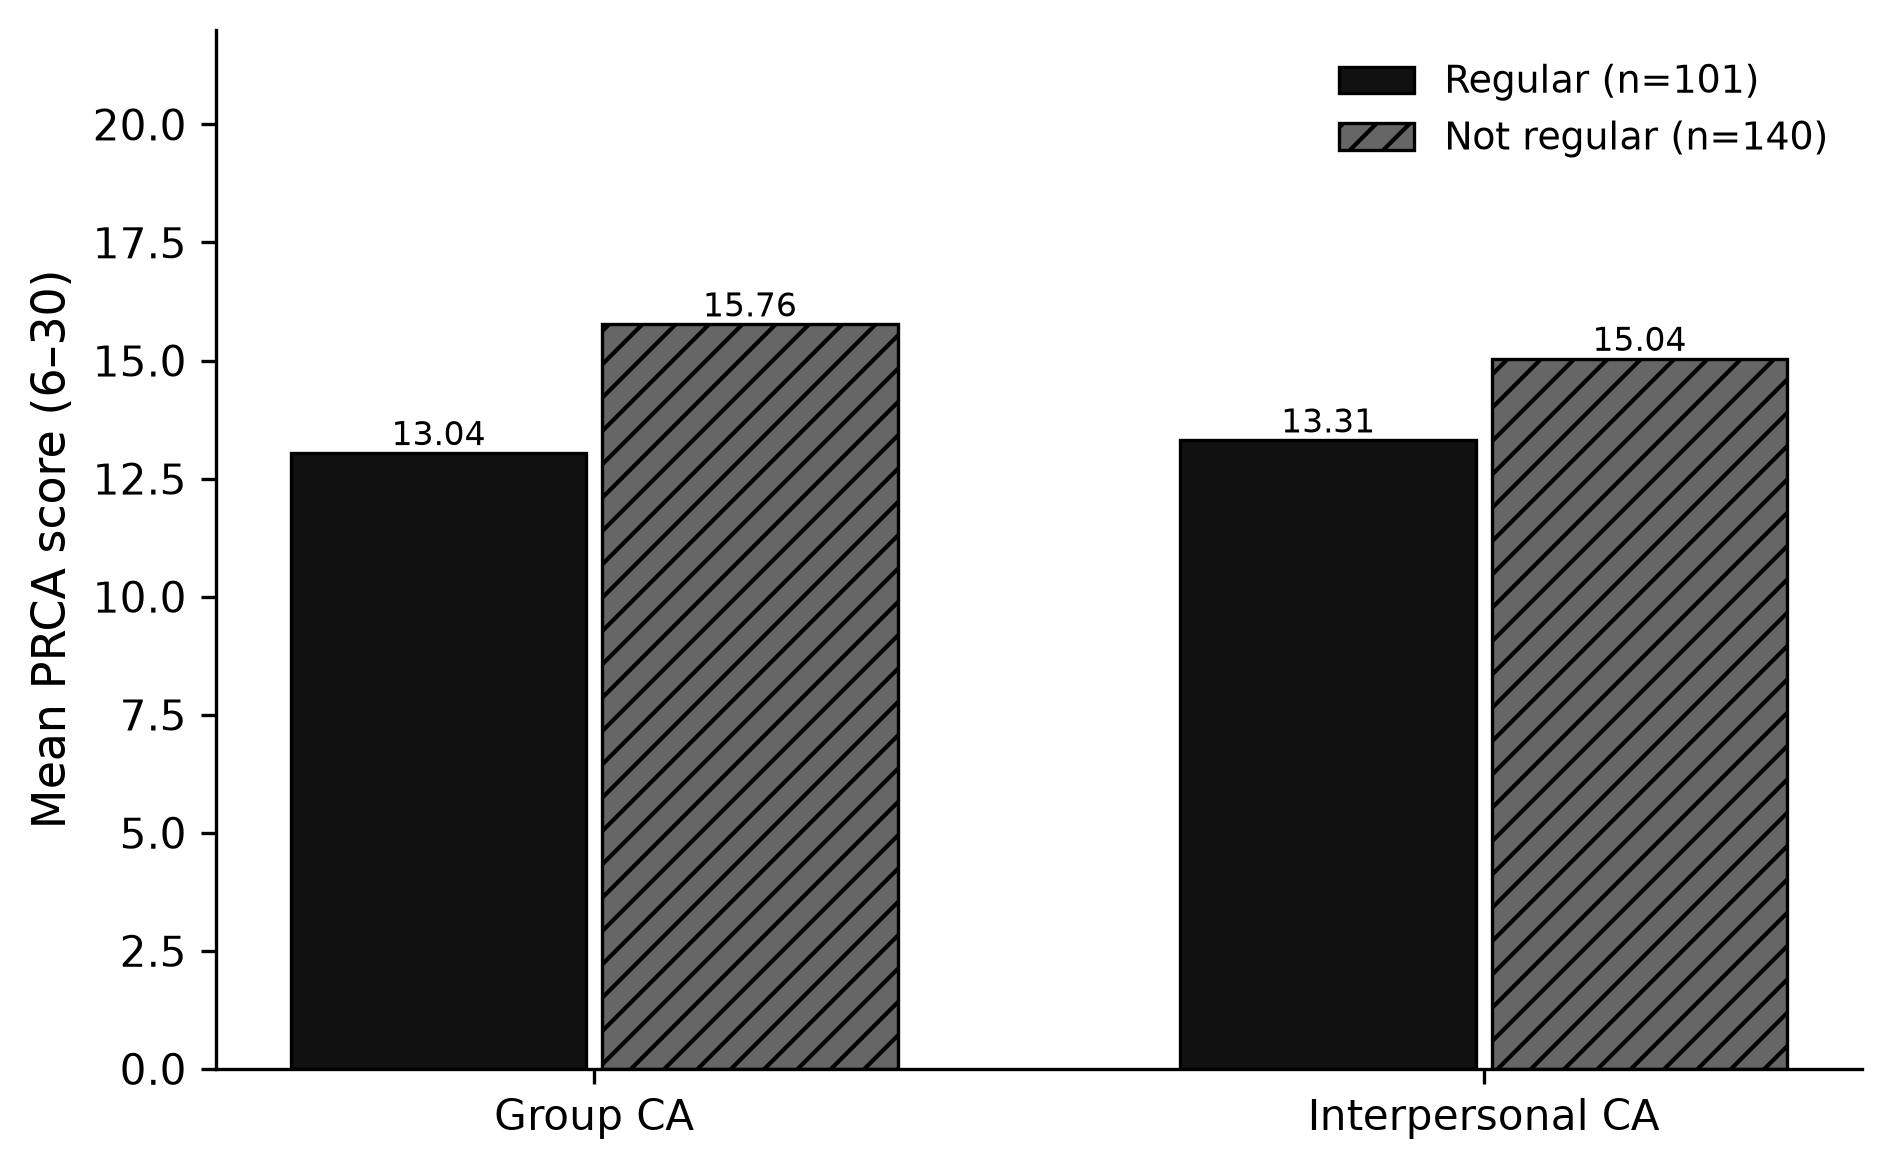Relative to the **overall** cohort mean (group 14.62; interpersonal 14.31), regular riders sit about **−1.58** / **−1.00** PRCA points lower (−10.8% / −7.0%).### Gradient by ridership intensityMean CA falls roughly monotonically as `Q26` ridership increases:| Q26 | n | Mean group CA | Mean interpersonal CA ||---|---:|---:|---:|| Never | 50 | 17.38 | 16.34 || 0–1 days/month | 37 | 15.38 | 15.16 || 2–4 days/month | 53 | 14.51 | 13.72 || 4–8 days/month | 46 | 13.28 | 13.48 || 8+ days/month | 55 | 12.84 | 13.16 |“Never” riders are the high-CA pole; weekly+ riders are the low-CA pole.### SensitivityAlternate definitions of “regular” (e.g., 8+ only vs weekly+) preserve the **direction** of the group-CA gap; magnitude and *p*-values shift with class balance. The weekly+ operationalization used elsewhere in the project is retained as the primary cut.## Interpretation**Yes — regular public-transit riders report lower communication apprehension than non-regular riders in this matched cohort.**1. **Direction.** Higher CA ↔ less weekly+ transit, on both subscales, with a clearer signal for **group** discussion anxiety (Δ = −2.72, *d* = −0.46, *p* = .0003).2. **Magnitude.** Cohen's *d* = −0.46 (group) and −0.30 (interpersonal): many high-CA respondents still ride, and many low-CA respondents do not.3. **Link to other secondary RQs.** Mean differences here become the CA→transit Random Forest signal (ROC-AUC = 0.590; [memo](../memos/ca_scores_predict_transit.qmd)) and sit beside geo→transit AUC = 0.551 ([memo](../memos/geo_predicts_transit.qmd)).4. **Implication for persona tiers.** When LLM prompts include transit frequency, they receive a cue empirically associated with true CA — so transit is a legitimate contextual feature, not an arbitrary demographic tag.## Limitations1. Same-wave association; causality (anxiety → avoid transit, transit → reduce anxiety, or third variables) cannot be separated.2. Self-report for both PRCA and `Q26`.3. Weekly+ threshold discards intensity within the regular group.4. Results describe this Prolific/Qualtrics matched cohort only.## Reproducibility```bashca-personas transit-ca --join innerjupyter nbconvert --to notebook --execute notebooks/secondary_rq_transit_ca.ipynb```Key outputs: `outputs/transit_ca/transit_ca_results_card.json`, `transit_ca_comparisons.csv`, `transit_ca_by_q26.csv`.

