Memo: Does geography predict regular transit?
Research memorandum — survey latitude & longitude
Research question: Does survey geographical location (latitude and longitude) predict whether an individual takes public transportation regularly?
Formal write-up: docs/secondary_rq_geo_predicts_transit.md
Companion CA write-up: docs/secondary_rq_ca_predicts_transit.md
1 Answer, Response, + Summary of Results
Using the Prolific↔︎Qualtrics matched cohort (File A + File B stacked joined to File C on Prolific ID / Q0; 252 matched rows; analytic n = 241 with complete PRCA items and non-missing Qualtrics LocationLatitude / LocationLongitude), we asked whether approximate survey geolocation predicts regular public-transit use. Regular transit is defined as Q26 ∈ {4–8 days a month, 8 or more days a month} (weekly-or-more). A balanced Random Forest ((Breiman, 2001); stratified 5-fold CV, random_state=42) used latitude and longitude as the sole features, compared against chance (ROC-AUC = 0.50) and a country-of-residence-only Random Forest baseline. Re-run with `ca-personas geo-transit-rf –join inner –seed 42and citeoutputs/geo_transit_rf/` for exact N.
Short answer: Lat/long recover above-chance discrimination (CV ROC-AUC = 0.551), essentially matching a country-only model (AUC = 0.549). Geography alone is not a competitive predictor of regular transit relative to Q28 (AUC = 0.762). The companion CA→transit RF yields AUC = 0.590 (see memos/ca_scores_predict_transit.md). Figure Figure 1 shows the geolocation scatter and ROC curve.
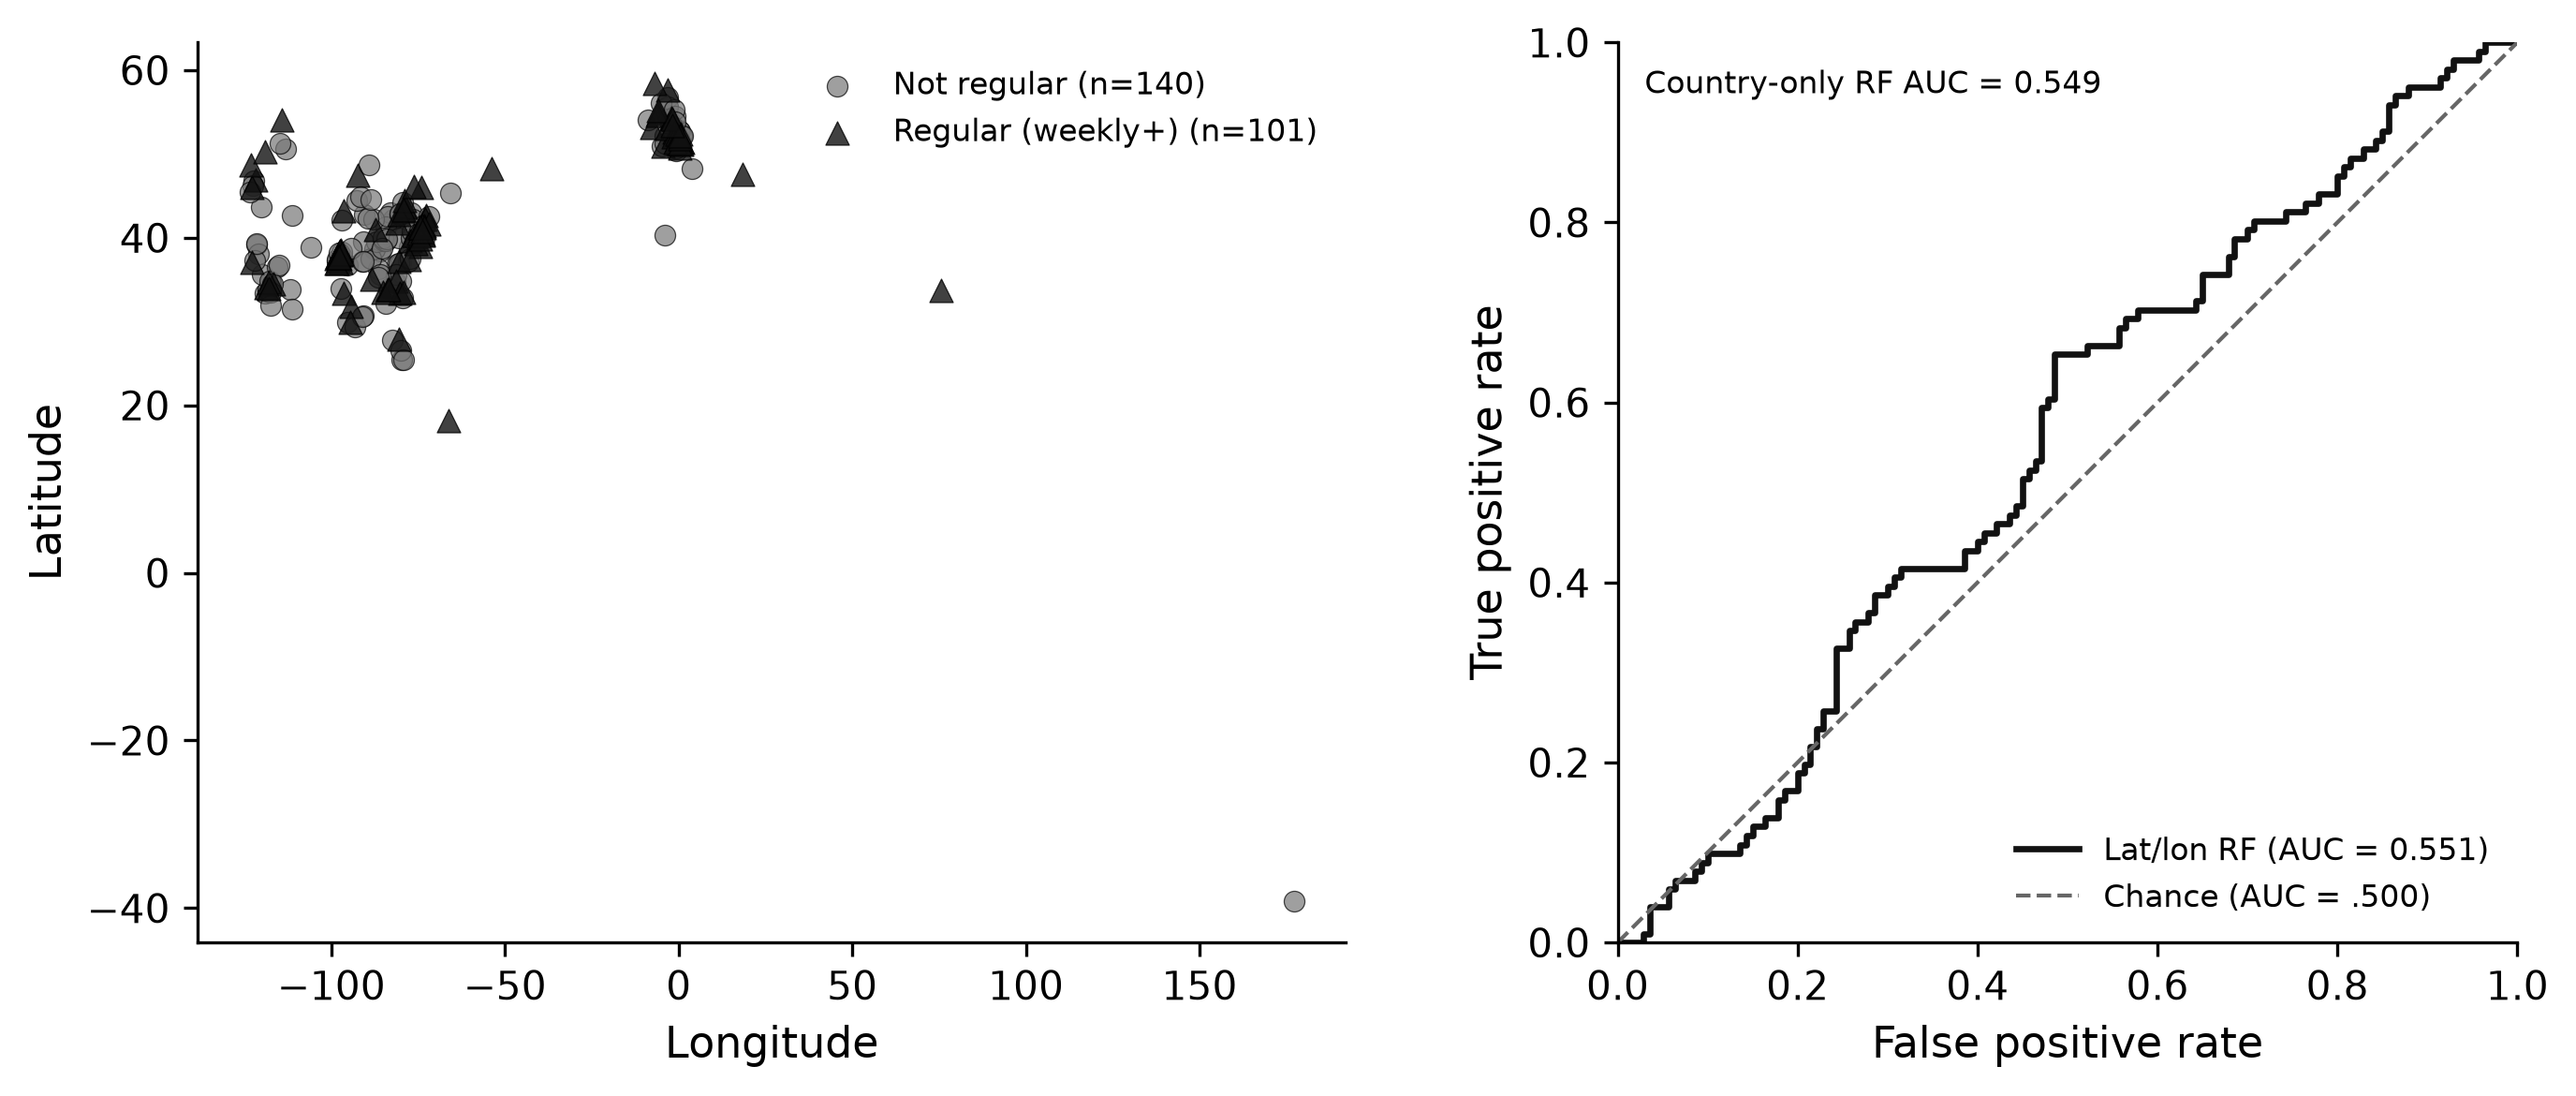
Spatial descriptives. Regular riders (n = 101) and non-regular riders (n = 140) overlap heavily in lat/lon space; mean coordinates differ only slightly (regular: lat = 43.05, lon = −62.00; not regular: lat = 41.10, lon = −69.07). Visual inspection of the scatter shows no sharp geographic separation between groups.
Random Forest (stratified CV). Predicting regular transit from latitude and longitude (see Table Table 1):
| Model | ROC-AUC |
|---|---|
| Latitude + longitude RF | 0.551 |
| Country-of-residence RF | 0.549 |
| Chance / prevalence | 0.500 |
Permutation importance ranks longitude (mean \(\Delta\)AUC = 0.335) above latitude (0.260). Continuous coordinates lift AUC by only ****+0.002**** over the country-only forest (0.551 − 0.549).
Conclusion. Qualtrics survey latitude and longitude recover CV ROC-AUC = 0.551 — above chance (0.500) but essentially equal to country-only (0.549) and below CA (0.590) and Q28 (0.762). These coordinates reflect approximate IP/browser geolocation rather than verified home addresses, so they should be interpreted as a coarse place cue, not a precise measure of transit accessibility.
Sources: notebooks/secondary_rq_geo_transit_rf.ipynb · src/ca_personas/geo_transit_rf.py · ca-personas geo-transit-rf · github.com/Exios66/psych755-jjb
2 What questions or uncertainties remain?
How much of the lat/long signal is simply country or urban/rural composition rather than local transit infrastructure? Would city-level or density features outperform raw coordinates? Same-wave Qualtrics geolocation may also misplace travelers or VPN users. Country of residence, tested directly against raw coordinates, is addressed in the follow-up country_predicts_transit.qmd (AUC ≈ 0.552 — statistically interchangeable with lat/long).
3 What other features may also well-predict regular public transit use?
Communication-apprehension scores (group and interpersonal PRCA) ((McCroskey, 1970)) were examined in a companion Random Forest (notebooks/secondary_rq_ca_transit_rf.ipynb) and recover AUC = 0.590 (ca_scores_predict_transit.qmd). The remaining candidates named here have now been tested head-to-head (Table Table 2):
| Candidate | Memo | Notebook | CV ROC-AUC |
|---|---|---|---|
Ride-share frequency (Q28/Q29) |
rideshare_predicts_transit.qmd |
secondary_rq_rideshare_transit_rf.ipynb |
0.745 |
Car license & access (Q20/Q21) |
car_access_predicts_transit.qmd |
secondary_rq_car_access_transit_rf.ipynb |
0.607 |
| Employment status | employment_predicts_transit.qmd |
secondary_rq_employment_transit_rf.ipynb |
0.528 |
| Joint mobility bundle | transit_covariate_followups.qmd |
secondary_rq_transit_covariate_followups.ipynb |
0.746 |
CLI: ca-personas covariate-transit-rf --join inner --seed 42.