Memo: What predicts Q27 intensity among regular riders?
Research memorandum — within-rider transit-day intensity classifiers
Research question: Among weekly+ public-transit riders, which covariates predict high transit-day intensity (Q27 ≥ 3–4 rides on a typical use day)?
Parent open question: q27_q28_predict_transit.qmd
1 Answer, Response, + Summary of Results
Among 101 regular riders, 35 (34.7%) report high intensity (3–4 / 5–6 / 7+ rides); 66 report the modal 1–2 rides. We treat high intensity as the binary target and evaluate candidate Random Forests ((Breiman, 2001); seed=42).
Short answer: Nothing predicts intensity well. The best family (Age+Sex+Student, n=95) reaches only AUC ≈ 0.549—near chance. CA (McCroskey, 1970), Q28, car access, and employment all fail as within-rider intensity classifiers (Figure Figure 1).
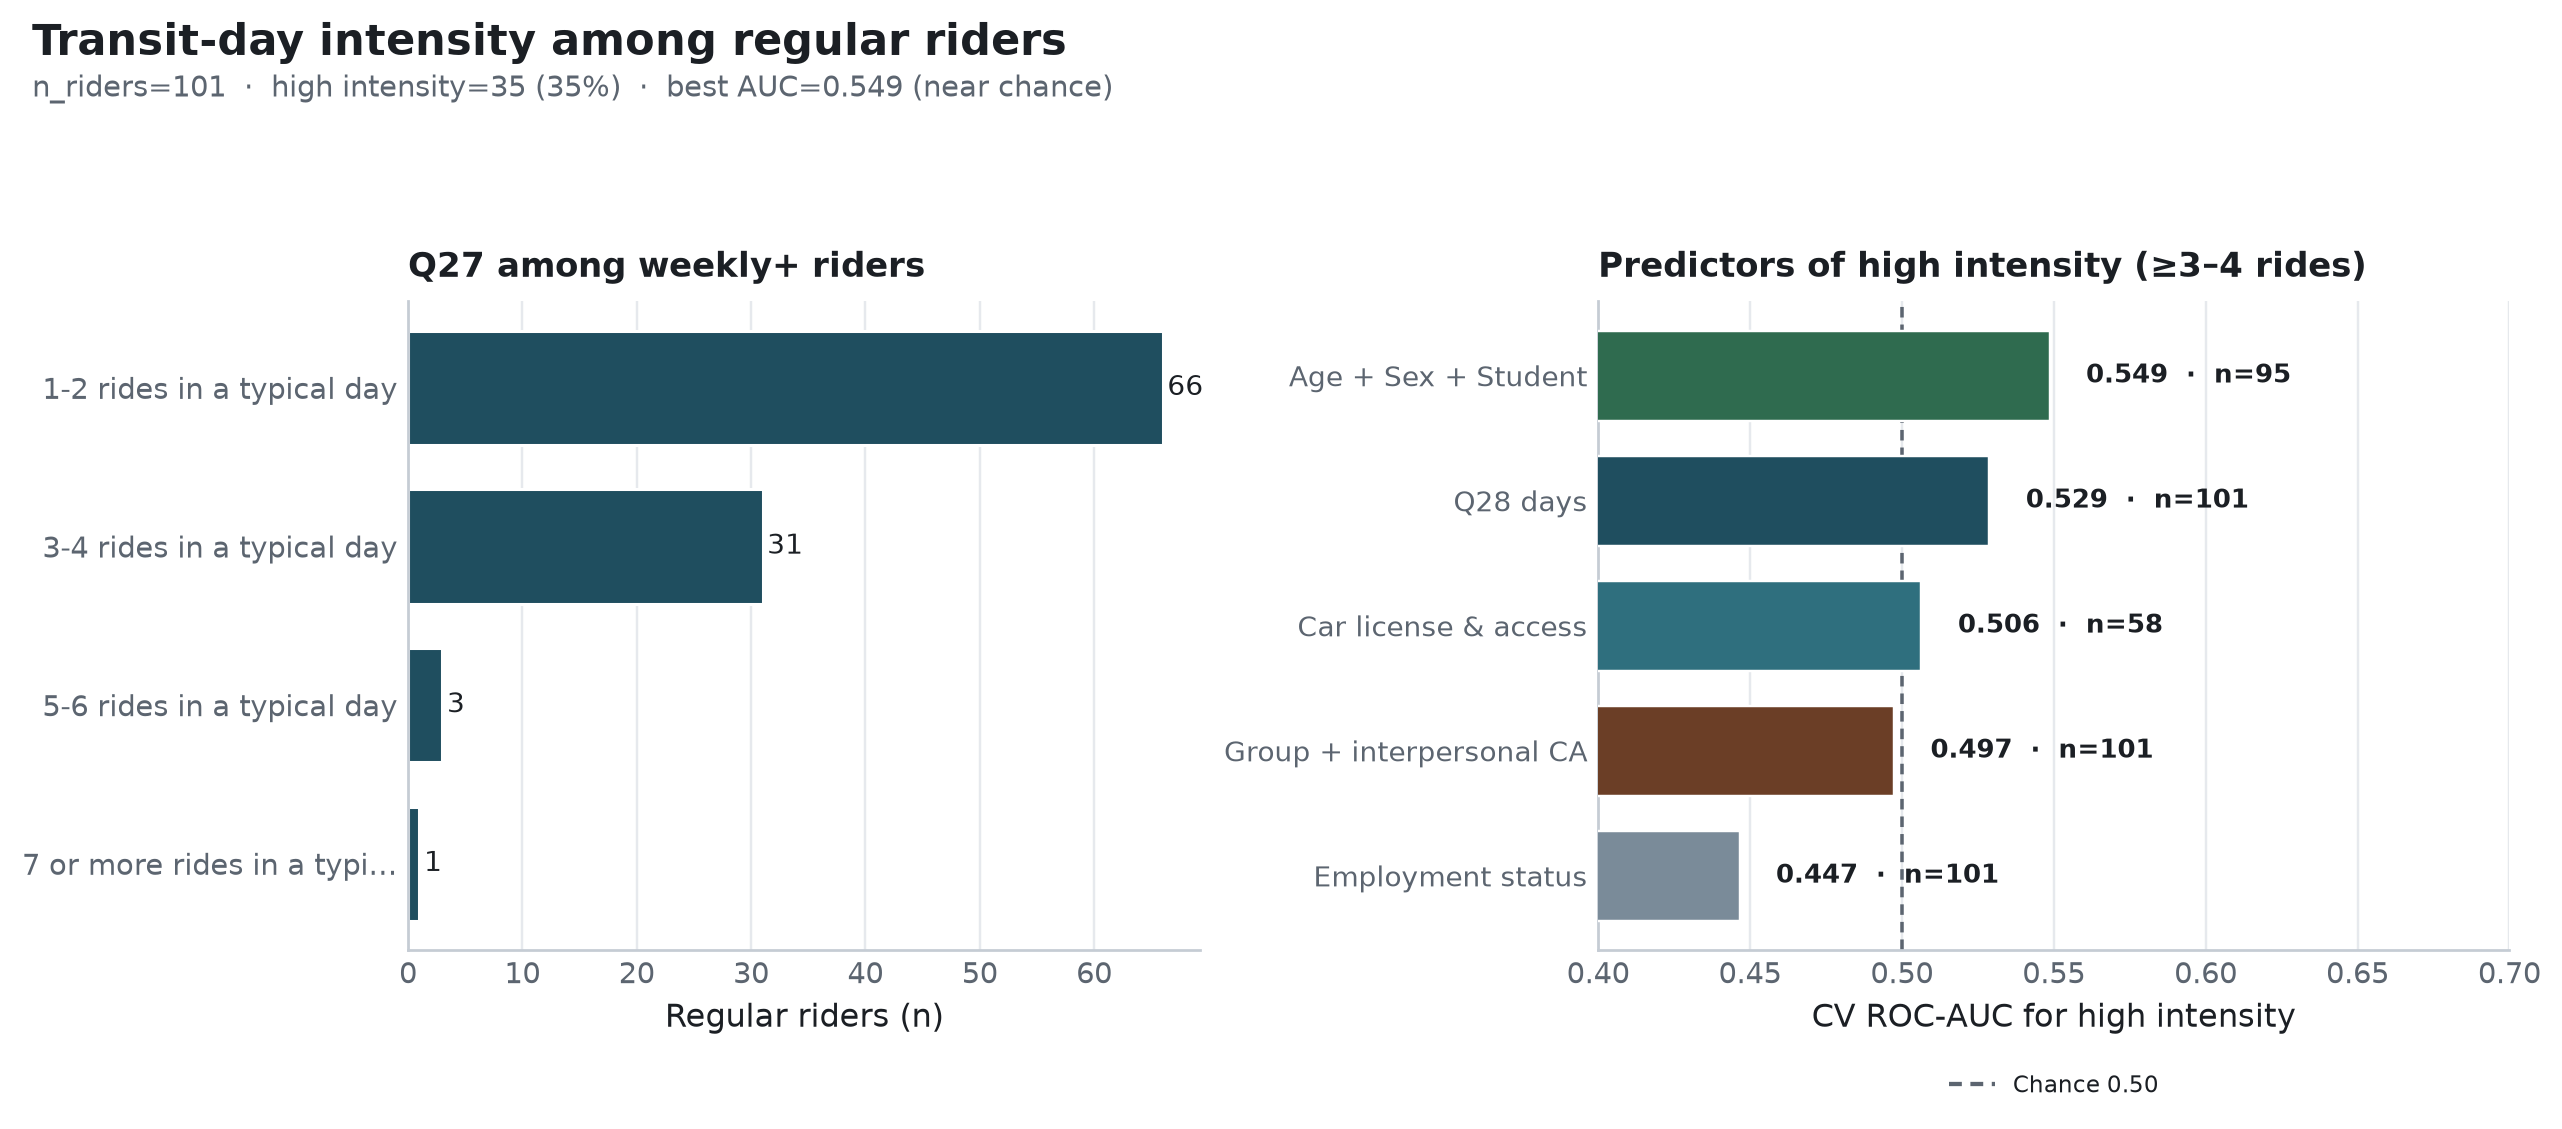
Q27-among-riders comparison
1.1 Q27 distribution among weekly+ riders
Table Table 1 shows the Q27 distribution among weekly+ riders.
Q27 intensity among regular riders.
Q27 |
n |
|---|---|
| 1–2 rides in a typical day | 66 |
| 3–4 rides in a typical day | 31 |
| 5–6 rides in a typical day | 3 |
| 7 or more rides in a typical day | 1 |
1.2 Candidate predictors of high intensity
Table Table 2 reports the candidate models for high intensity.
| Model | n | ROC-AUC |
|---|---|---|
| Age + Sex + Student | 95 | 0.549 |
Q28 days |
101 | 0.529 |
Car access (Q21) |
58 | 0.506 |
| Group + interpersonal CA | 101 | 0.496 |
| Employment status | 101 | 0.447 |
| Chance | — | 0.500 |
1.3 Interpretation
- Answers the
Q27/Q28memo’s within-subgroup question:Q27is not a useful secondary forecasting target among already-regular riders in this cohort.
- Combined with wave-1 results (
Q27alone AUC ≈ 0.589 for the weekly+ threshold), intensity items are weak both as predictors of and as outcomes within regular ridership.
- Persona prompts that lean on “rides per day” without ride-share days are emphasizing a low-signal mobility facet.
Sources: ca-personas followup-experiments --experiments q27_among_regular · outputs/followup_experiments/q27_among_regular/ · formal write-up docs/secondary_rq_followup_experiments.md
2 What questions or uncertainties remain?
Would continuous or ordinal models of Q27 (instead of a high/low split) recover more signal, or is intensity simply noisy self-report in this instrument?