Memo: Common-N head-to-head of transit predictors
Research memorandum — equal complete-case ranking of major feature families
Research question: When every major predictor family is evaluated on the same complete-case subset, which features still rank highest for regular-transit discrimination?
Motivation: Wave-1 AUCs used unequal N (car ≈149; Q28 ≈241; employment ≈241). Ranking could be confounded by missingness.
1 Answer, Response, + Summary of Results
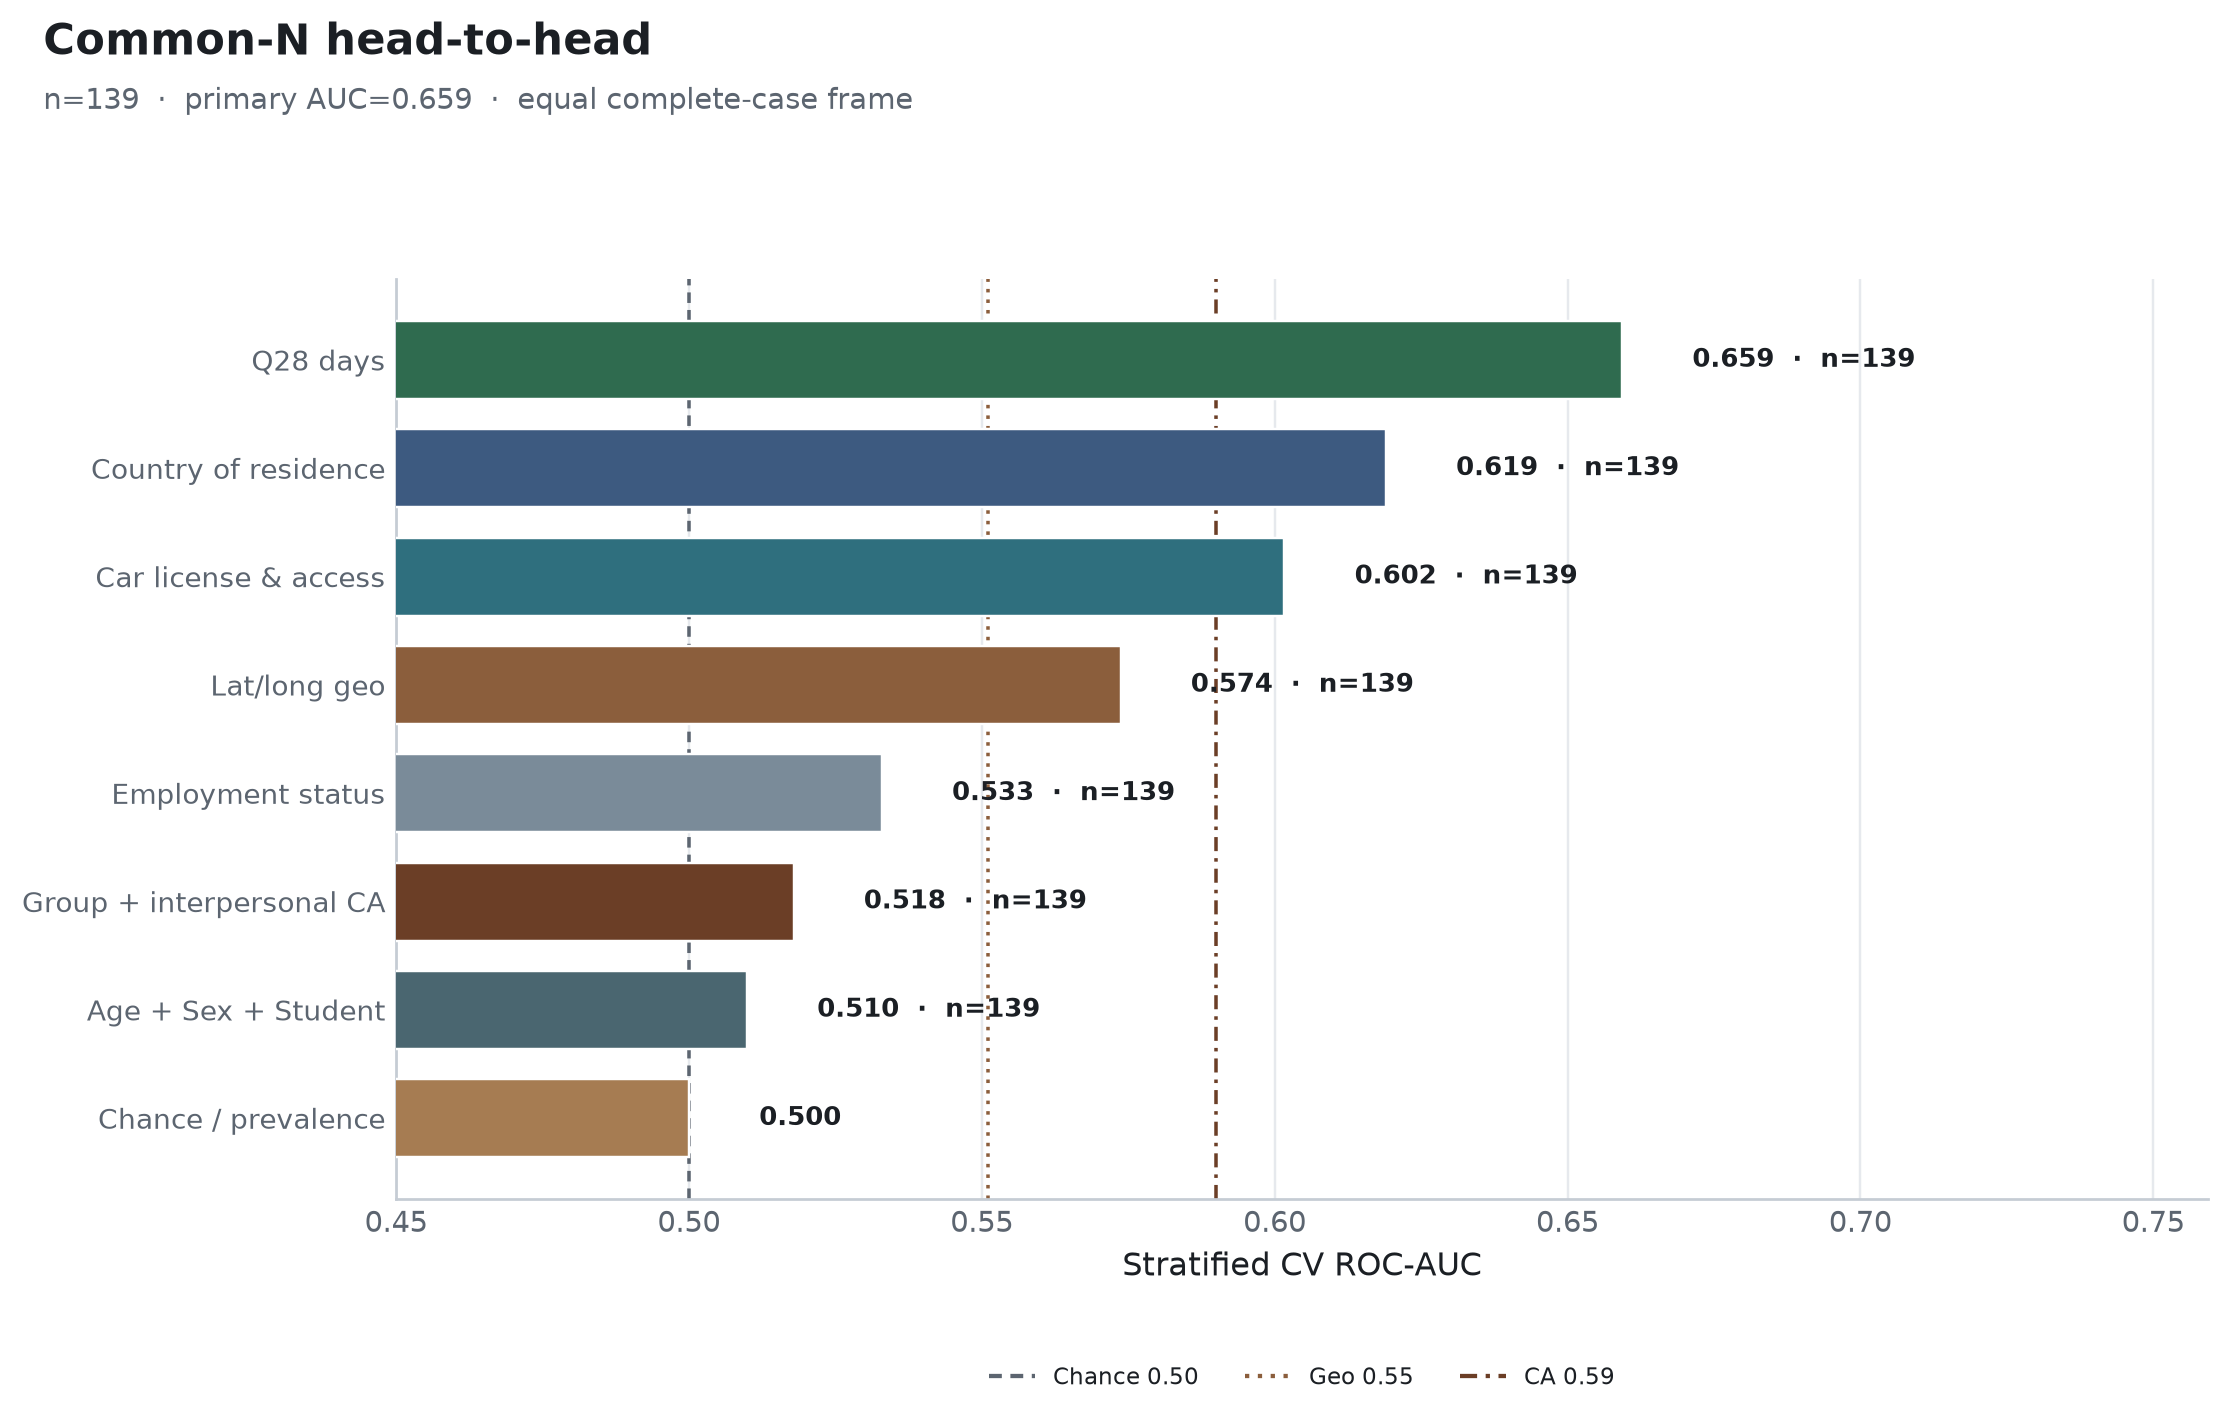
Requiring complete Age, Sex, Student status, Country, Employment, Q20/Q21, Q28, CA scores (McCroskey, 1970), and lat/long yields n = 139 (56 regular; prevalence 40.3%). Each family is re-fit as a balanced Random Forest with stratified CV ((Breiman, 2001); seed=42) on this shared frame.
Short answer: Q28 still wins (AUC ≈ 0.659). Country and car remain mid-tier. Geo is weak-modest. Employment, CA, and demographics fall near chance on this restricted overlap (Figure Figure 1).
1.1 Equal-N CV ranking (n = 139)
Table Table 1 reports the equal-N CV ranking across feature families.
| Feature family | ROC-AUC |
|---|---|
Q28 days |
0.659 |
| Country of residence | 0.619 |
| Car license & access | 0.602 |
| Lat/long geo | 0.573 |
| Employment status | 0.533 |
| Group + interpersonal CA | 0.517 |
| Age + Sex + Student | 0.511 |
| Chance / prevalence | 0.500 |
1.2 Interpretation
- The wave-1 conclusion that ride-share days dominate is not an artifact of unequal complete-case samples.
- Absolute AUCs shrink versus full-cohort
Q28(0.762 → 0.659) because the overlap is smaller and more selected—but the ordinal ranking is stable.
- Demographics’ modest full-sample AUC (0.618) does not survive once the sample is the car/mobility-complete subset—selection matters for demography more than for
Q28.
Sources: ca-personas followup-experiments --experiments common_n · outputs/followup_experiments/common_n/ · formal write-up docs/secondary_rq_followup_experiments.md
2 What questions or uncertainties remain?
Would a multiply-imputed analysis restore demographics/CA while preserving the Q28 lead, or would imputation attenuate rideshare’s advantage? — Answered in mi_head_to_head.qmd: Q28 singleton lead preserved; demos/CA not restored to competitive levels.