Memo: Geo-memo follow-ups — which covariates predict regular transit?
Research memorandum — car access, employment, ride-share head-to-head
Research question: Among the candidates listed in the geography → transit memo—car license/access (Q20/Q21), employment status, and ride-share frequency (Q28/Q29)—which features best predict regular public-transit use?
Parent memo: geo_predicts_transit.qmd
Family memos: car_access_predicts_transit.qmd · employment_predicts_transit.qmd · rideshare_predicts_transit.qmd · q27_q28_predict_transit.qmd (Q27 vs Q28 traditional ML)
1 Answer, Response, + Summary of Results
We re-used the Prolific↔︎Qualtrics matched analytic definition (weekly+ Q26 outcome; companion geo AUC = 0.551, CA AUC = 0.590 (McCroskey, 1970), chance = 0.500) and ran balanced Random Forests ((Breiman, 2001)) with stratified 5-fold CV (seed=42) for each feature family, plus a joint mobility bundle. Complete-case N differs by family because Q20/Q21 (and some Q29) are missing more often than employment or Q28.
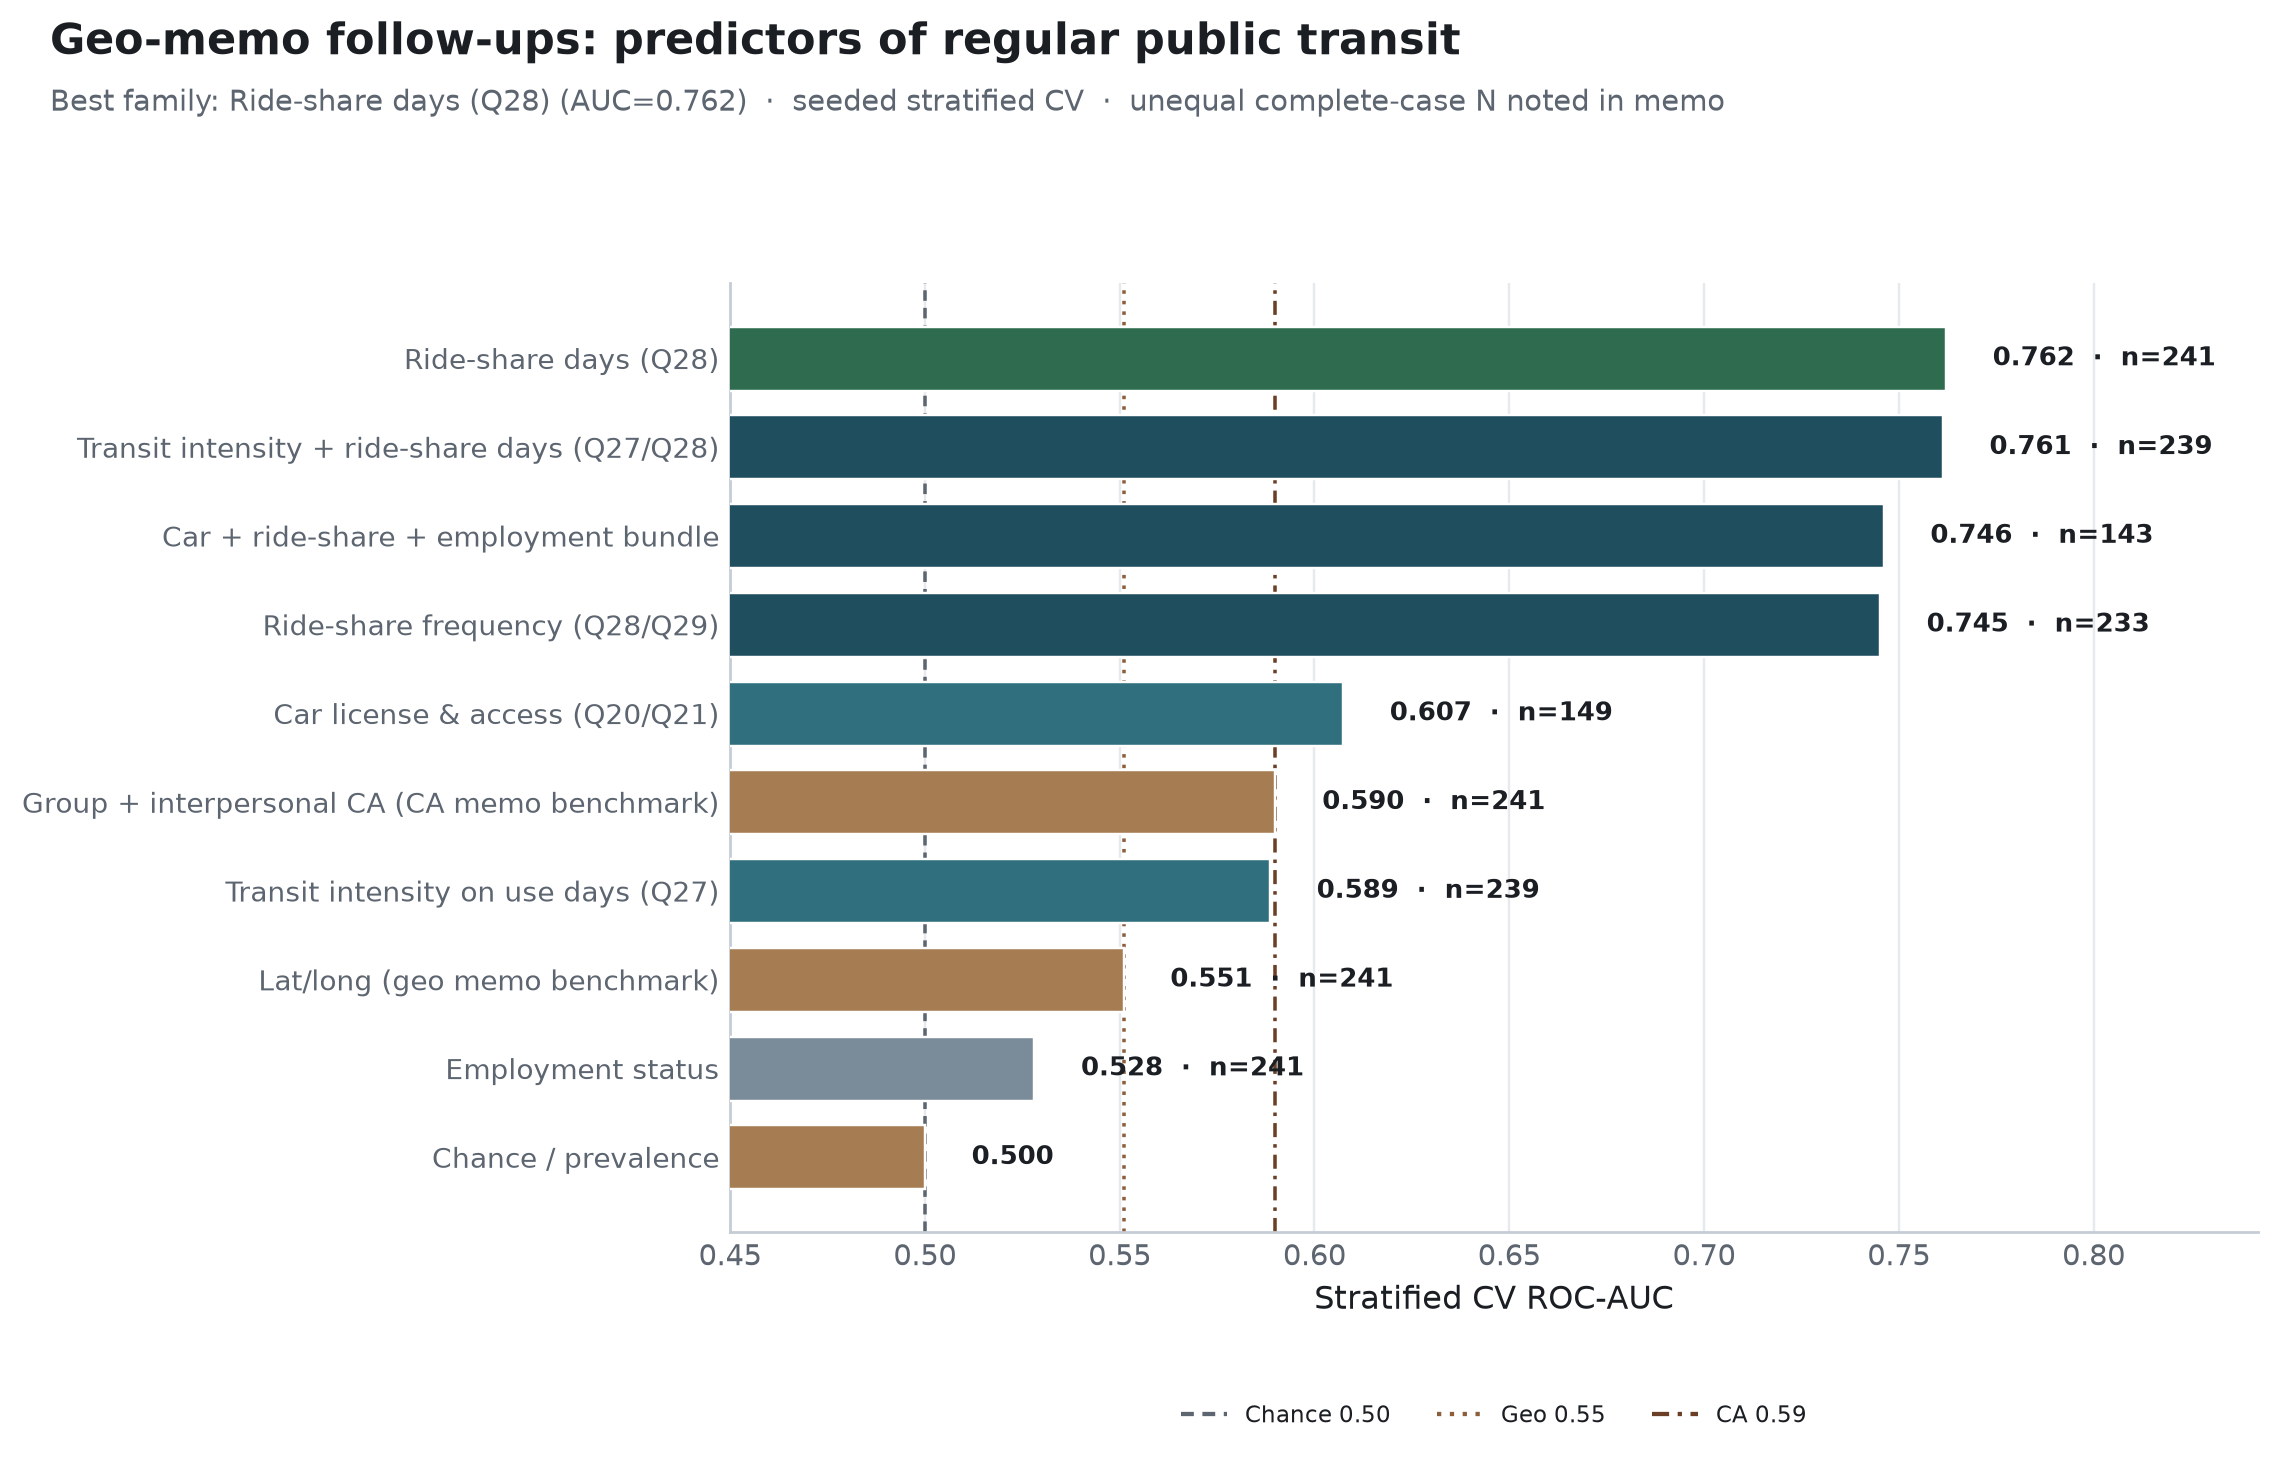
Short answer: Q28 alone recovers the highest AUC in the suite (0.762; q27_q28_predict_transit.qmd). The Q28/Q29 rideshare family reaches 0.745; car access 0.607; employment 0.528. Bundling car+employment+ride-share (0.746 on n = 143) does not meaningfully beat ride-share alone once N shrinks to respondents with complete car items (Figure Figure 1).
1.1 Head-to-head CV performance
Table Table 1 reports the head-to-head CV performance for each feature family.
| Feature family | Analytic n | Regular | ROC-AUC | vs geo | vs CA |
|---|---|---|---|---|---|
Q28 only |
241 | 101 | 0.762 | ✓ | ✓ |
Mobility bundle (Q20/Q21 + Q28/Q29 + employment) |
143 | 56 | 0.746 | ✓ | ✓ |
Ride-share (Q28/Q29) |
233 | 99 | 0.745 | ✓ | ✓ |
Car license & access (Q20/Q21) |
149 | 58 | 0.607 | ✓ | ✓ |
| Group + interpersonal CA (benchmark) | 241 | 101 | 0.590 | ✓ | — |
Q27 only |
239 | 101 | 0.589 | ✓ | ≈ |
| Lat/long (benchmark) | 241 | 101 | 0.551 | — | — |
| Employment status | 241 | 101 | 0.528 | ✗ | ✗ |
| Chance / prevalence | — | — | 0.500 | — | — |
1.2 What drives the ranking
Q28ride-share days shows a steep prevalence gradient (Never = 15.7% regular → 8+ days/month = 94.1% regular) and dominates permutation importance in both the rideshare-only and bundle models.Q21car access separates groups sharply among complete cases (No access = 76.0% regular vs Yes = 30.9%), lifting car-only AUC to 0.607 above CA/geo despite smaller N.- Employment (Full-Time / Part-Time / Other) recovers AUC = 0.528; treat it as a control, not a primary classifier.
- The bundle (AUC = 0.746) is only +0.002 above ride-share alone (0.745) on the overlapping complete-case subset, indicating limited incremental value from car/employment once ride-share is in the model.
Conclusion. For predicting weekly+ public transit in this cohort, ride-share items (Q28 AUC = 0.762; Q28/Q29 AUC = 0.745) exceed survey geolocation (0.551) and CA scores (0.590); car access (0.607) is a secondary mobility cue; employment (0.528) is not competitive. Same-wave self-reports still preclude causal claims, and AUCs should not be compared naively across unequal complete-case samples without that caveat.
Sources: notebooks/secondary_rq_transit_covariate_followups.ipynb · src/ca_personas/transit_covariate_rf.py · ca-personas covariate-transit-rf · artifacts outputs/transit_covariate_rf/ · github.com/Exios66/psych755-jjb
2 What questions or uncertainties remain?
Would a model that includes CA + ride-share + car access on a multiply-imputed frame change the relative importance of psychological vs mobility predictors? How much of the Q28–Q26 association is multimodality versus shared urban lifestyle confounds?
Answered in follow-ups: the multiply-imputed head-to-head is mi_head_to_head.qmd (Q28’s lead preserved); CA + Q28 + car on a complete-case frame is ca_mobility_joint_predicts_transit.qmd (joint AUC 0.736); Q28 conditional on car is q28_conditioned_on_car.qmd; country × car is country_car_predicts_transit.qmd; equal-N ranking is common_n_head_to_head.qmd.
3 What other features may also well-predict regular public transit use?
City/density proxies, country-of-residence interactions with car access, and student status remain open. The geo memo’s questions about VPN/IP geolocation quality also still apply when place cues are reintroduced alongside mobility items. Student-status and demographic follow-ups are in demographics_predict_transit.qmd, and the kitchen-sink ceiling is in comprehensive_predictors_transit.qmd.
Formal write-up: docs/secondary_rq_transit_covariate_followups.md