Memo: Multiply-imputed vs complete-case head-to-head
Research memorandum — does MI restore demos/CA or attenuate Q28’s lead?
Research question: Would a multiply-imputed analysis restore demographics/CA while preserving the Q28 lead, or would imputation attenuate rideshare’s advantage?
Parent: common_n_head_to_head.qmd · Companions: q28_conditioned_on_car.qmd · demographics_predict_transit.qmd · ca_scores_predict_transit.qmd
1 Answer, Response, + Summary of Results
We compare each predictor family under listwise complete-case versus \(M = 20\) multivariate imputations of the missing-prone items (Q20, Q21, Student status), using chained equations (IterativeImputer, sample_posterior=True (Pedregosa et al., 2011)) with complete auxiliaries (Age, Sex, CA (McCroskey, 1970), Q28, employment, country, lat/long). Outcome-labeled base n = 241 (seed 42, stratified CV). Q28 and CA are never imputed—they appear in both arms as observed.
Short answer: Q28’s singleton lead is preserved under MI (AUC ≈ 0.762). Demographics and CA are not restored to competitive levels (≈ 0.617 and 0.590); imputation does not attenuate rideshare’s advantage among single-family models. Joint models that include Q28 remain strongest (CA+Q28+car MI ≈ 0.808; Figure Figure 1).
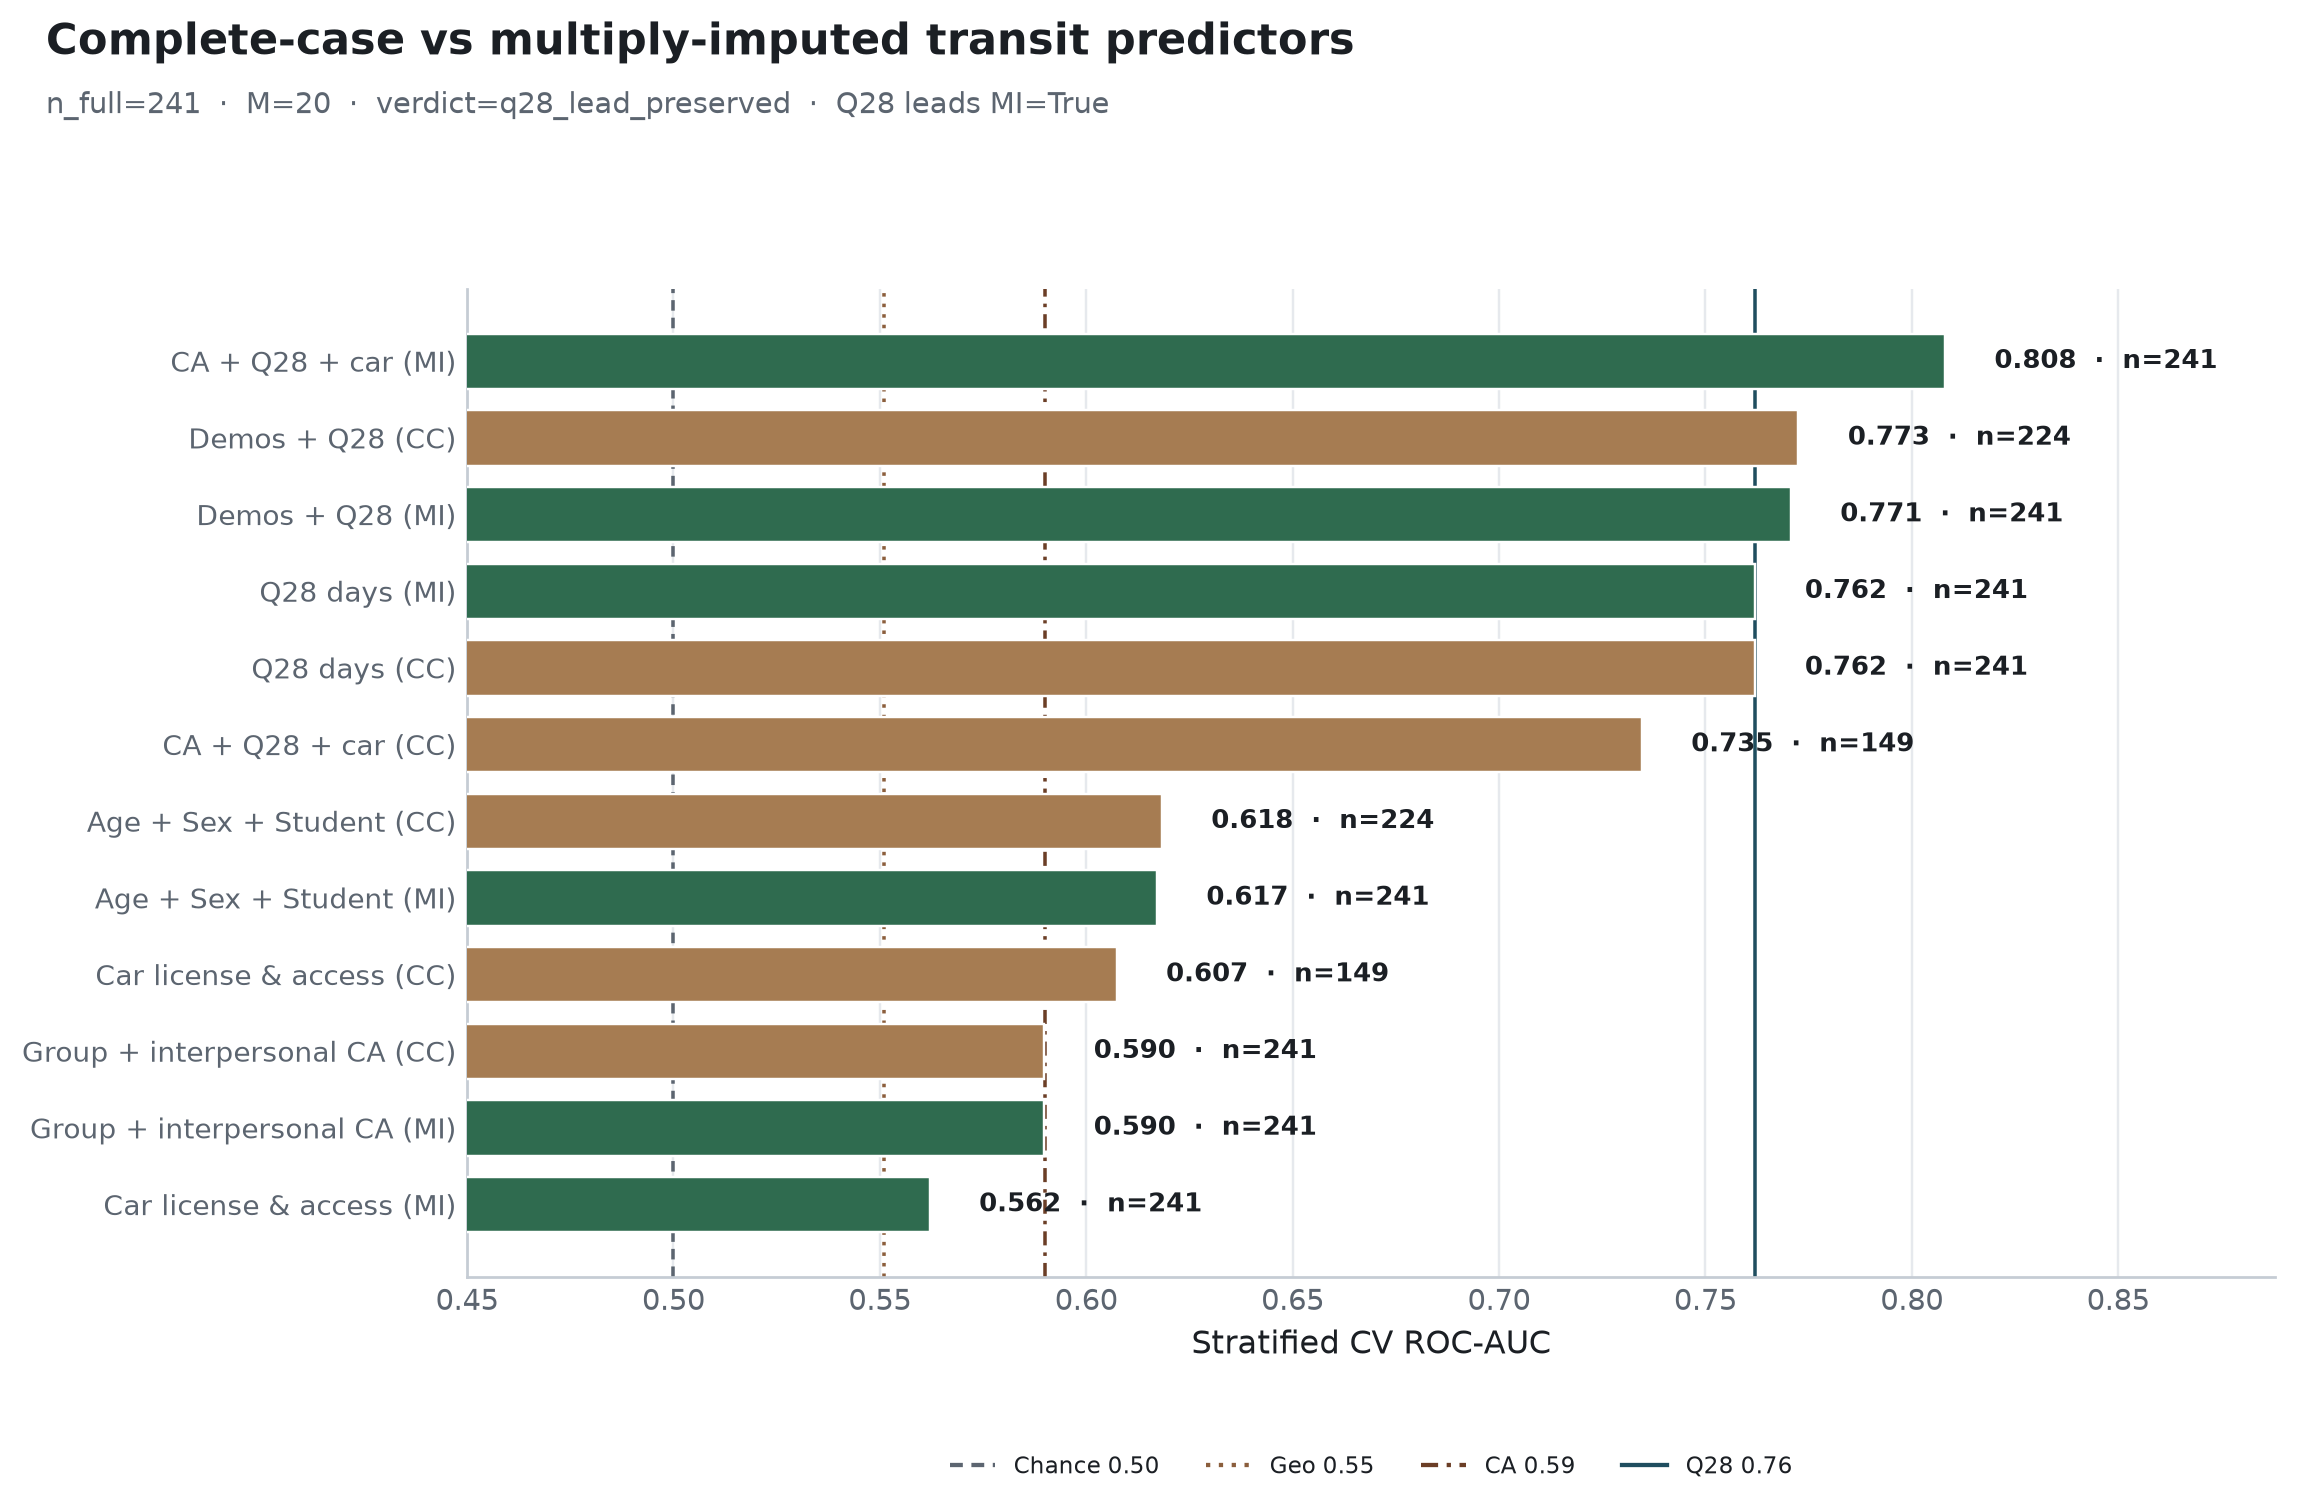
1.1 Complete-case vs multiply-imputed ranking (n_full = 241)
Table Table 1 reports complete-case and multiply-imputed AUCs for each feature family.
| Feature family | CC n | CC AUC | MI n | MI AUC | Δ (MI − CC) |
|---|---|---|---|---|---|
CA + Q28 + car (joint) |
149 | 0.736 | 241 | 0.808 | +0.072 |
Demos + Q28 (joint) |
224 | 0.773 | 241 | 0.771 | −0.002 |
Q28 days |
241 | 0.762 | 241 | 0.762 | 0.000 |
| Age + Sex + Student | 224 | 0.618 | 241 | 0.617 | −0.001 |
| Group + interpersonal CA | 241 | 0.590 | 241 | 0.590 | 0.000 |
| Car license & access | 149 | 0.607 | 241 | 0.562 | −0.045 |
Singleton MI order: Q28 ≫ demographics ≫ CA ≳ car.
1.2 Interpretation
- Rideshare advantage is not an artifact of complete-case N. On the full analytic frame with MI-filled car/student items,
Q28still outranks demographics, CA, and car as a singleton family—the same ordinal conclusion as the common-N memo.
- MI does not “restore” demos/CA. Expanding Student-missing rows to n = 241 leaves demographics ≈ 0.617 (flat vs their own CC). CA is unchanged because it was already complete. Neither approaches
Q28.
- Imputation mainly helps joint mobility models. Filling
Q20/Q21lets CA+Q28+car train on all 241 rows and lifts AUC (0.736 → 0.808). Standalone car weakens under MI (0.607 → 0.562)—imputed car is a noisier cue than car observed on the selected complete-case subset.
- Joint demos+
Q28stays high (~0.77) but still tracksQ28rather than a demography rebound.
Sources: ca-personas followup-experiments --experiments mi_head_to_head --n-imputations 20 · outputs/followup_experiments/mi_head_to_head/ · Posit full-cohort artifacts (n = 241) · formal write-up docs/secondary_rq_followup_experiments.md
2 What questions or uncertainties remain?
Would a richer imputation model (e.g. including interaction terms, or imputing under a MAR vs MNAR sensitivity design) change the car attenuation pattern? Would ordinal / multilevel MI of Q28 strata alter residual-CA contrasts within ride-share days?