Memo: Does ride-share frequency predict regular transit?
Research memorandum — Q28/Q29 follow-up to the geography memo
Research question: Does ride-share use (Q28 days; Q29 typical rides) predict whether a matched respondent takes public transportation regularly?
Parent memo: geo_predicts_transit.qmd
Q27/Q28 focused memo: q27_q28_predict_transit.qmd · manuscript § in index.qmd
Comparison memo: transit_covariate_followups.qmd
1 Answer, Response, + Summary of Results
Using the matched analytic cohort with complete Q28/Q29 (n = 233; 99 regular / 134 not regular; prevalence = 42.5%), we fit a balanced Random Forest ((Breiman, 2001); stratified 5-fold CV, seed=42) predicting weekly+ transit from ride-share days in the last three months (Q28) and rides on a typical ride-share day (Q29).
Short answer: Yes — ride-share frequency exceeds geography and CA on CV ROC-AUC. Ride-share frequency recovers CV ROC-AUC = 0.745, well above chance (0.500), geo (0.551), and CA (0.590). Signal is driven almost entirely by Q28. Figure Figure 1 shows prevalence by level and the ROC curve.
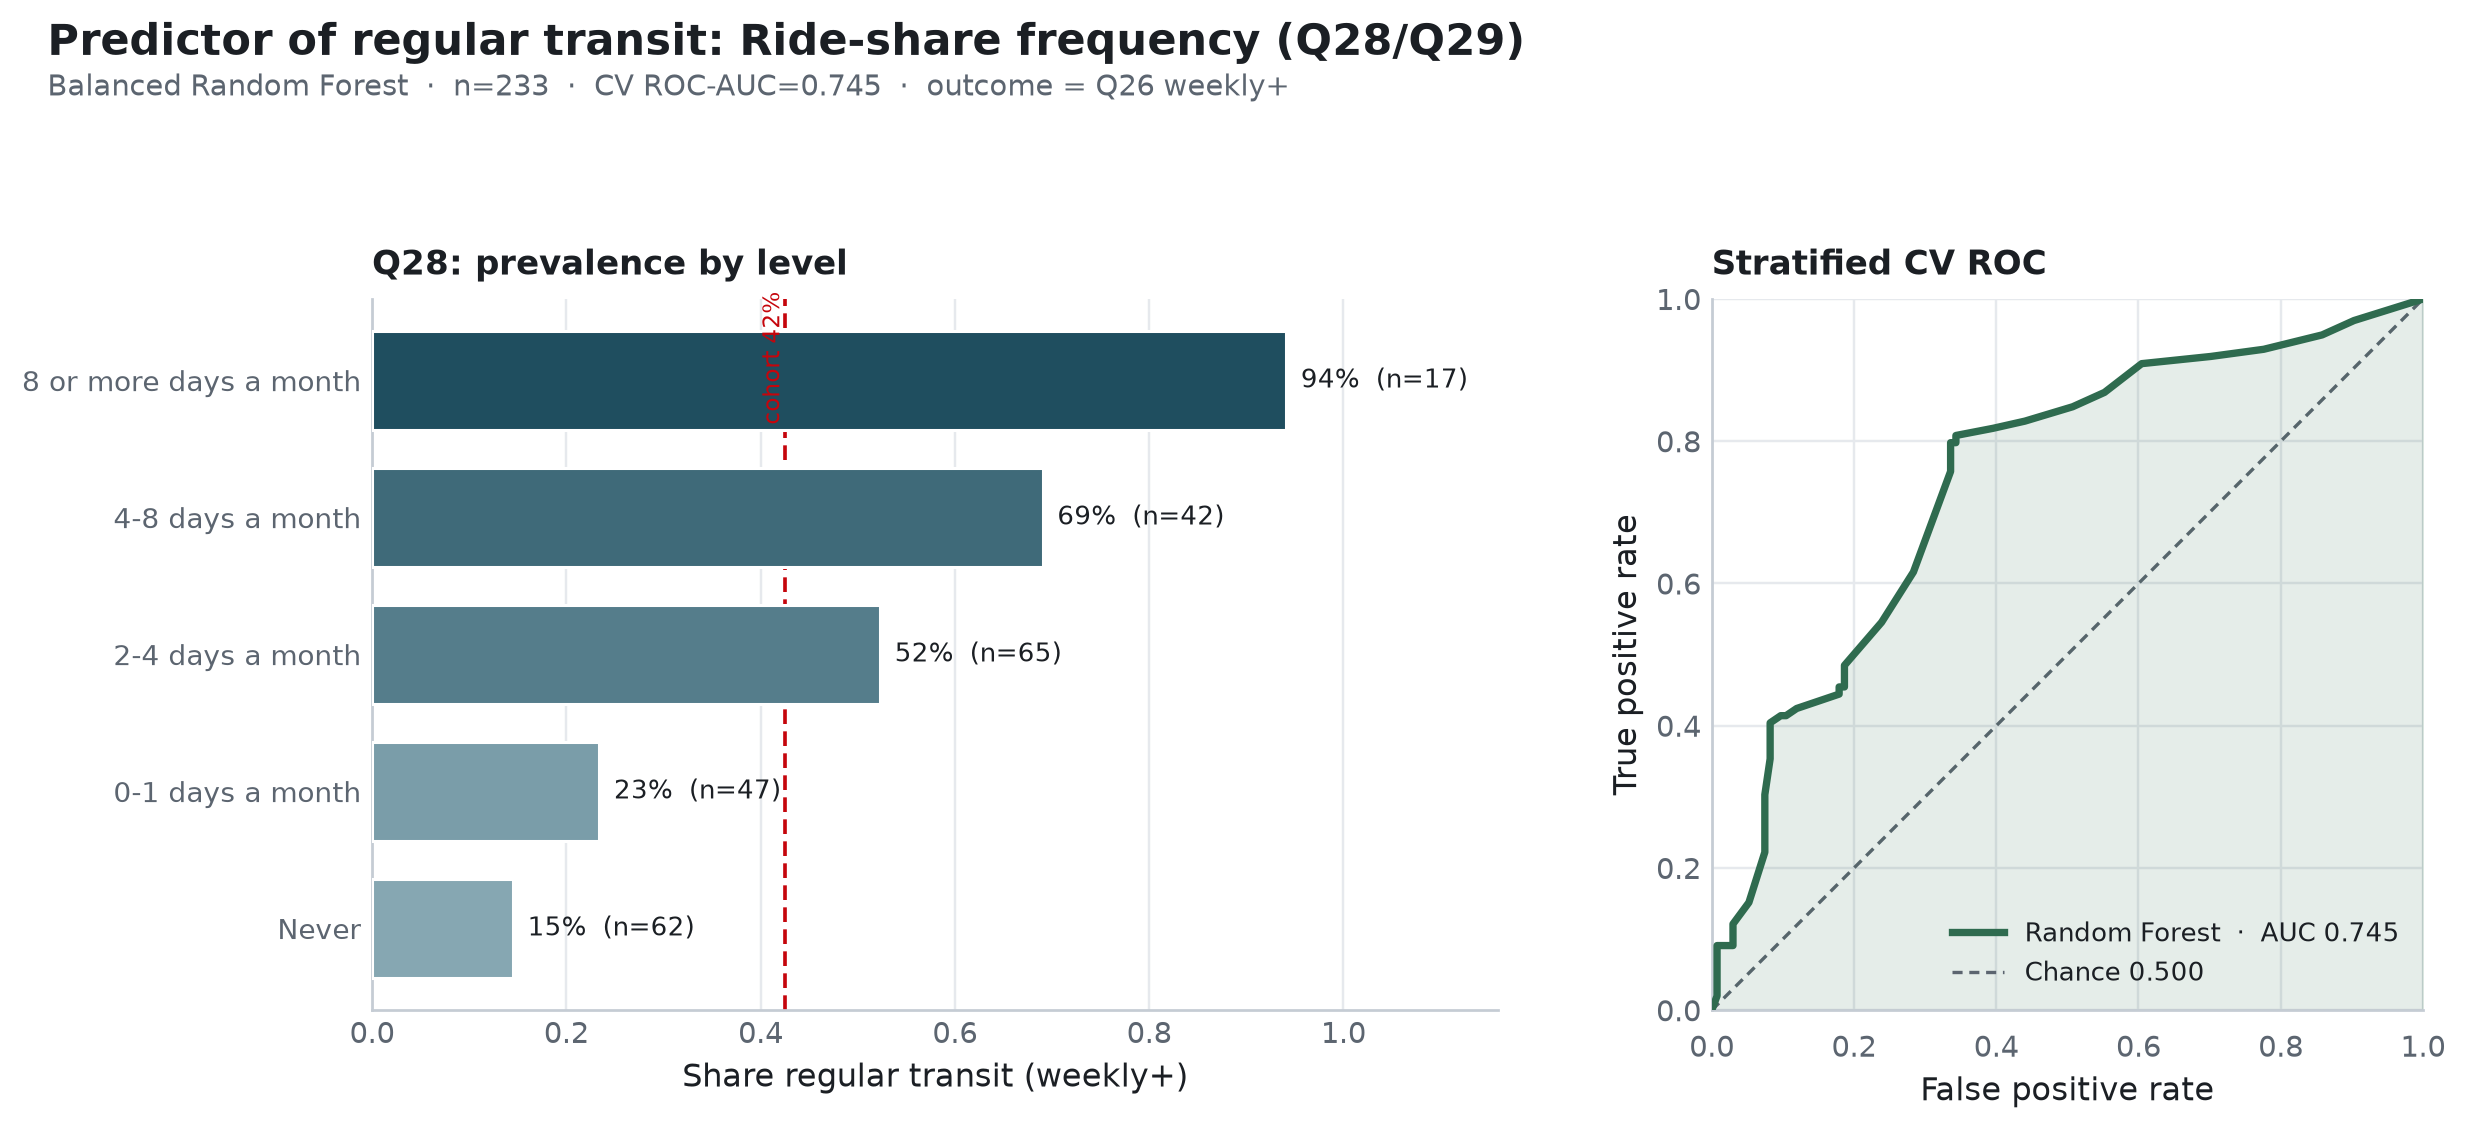
Descriptive associations (Q28). Regular transit rises monotonically with ride-share days (Table Table 1):
Q28 ride-share days by regular transit status.
Q28 (ride-share days) |
n | % regular |
|---|---|---|
| Never | 62 | 14.5% |
| 0–1 days a month | 47 | 23.4% |
| 2–4 days a month | 65 | 52.3% |
| 4–8 days a month | 42 | 69.0% |
| 8 or more days a month | 17 | 94.1% |
Q29 (rides per typical day) shows a milder gradient and is sparsely populated above 1–2 rides.
Random Forest (stratified CV). Table Table 2 reports the CV results.
| Model | n | ROC-AUC | Balanced acc. | F1 |
|---|---|---|---|---|
Q28 + Q29 RF |
233 | 0.745 | 0.731 | 0.709 |
| CA RF benchmark | 241 | 0.590 | — | — |
| Geo RF benchmark | 241 | 0.551 | — | — |
| Chance | — | 0.500 | 0.500 | — |
Permutation importance: Q28 mean \(\Delta\)AUC = 0.291 vs Q29 = 0.015. Average precision = 0.655 and Brier = 0.197. Relative to geo (AUC = 0.551) and CA (AUC = 0.590), the rideshare family gains +0.194 and +0.155 AUC respectively.
Conclusion. Among the geo-memo follow-up candidates, the Q28/Q29 family recovers the highest stand-alone AUC in that trio (0.745); Q28 alone reaches 0.762 (q27_q28_predict_transit.qmd). The association is theoretically expected (shared mobility habits / multimodal travelers) but is still same-wave and non-causal; Q28 and Q26 may also share response styles or urban lifestyle confounds.
Sources: notebooks/secondary_rq_rideshare_transit_rf.ipynb · src/ca_personas/transit_covariate_rf.py · ca-personas covariate-transit-rf --specs rideshare · github.com/Exios66/psych755-jjb · formal write-up docs/secondary_rq_transit_covariate_followups.md
2 What questions or uncertainties remain?
How much of the Q28→Q26 link is multimodality versus correlated urbanicity/income? Would excluding same-domain mobility items change persona-tier evaluation differently from this reverse-prediction task?
3 What other features may also well-predict regular public transit use?
Car access recovers AUC = 0.607 (car_access_predicts_transit.qmd); the joint car+employment+ride-share bundle recovers AUC = 0.746 on n = 143 — only +0.002 over ride-share alone on that smaller complete-case subset (transit_covariate_followups.qmd).